A Helmholtz Resonator with Spiral Neck for Analyte Concentration Measurement in Low Frequency Range

1
Department of Mechanical Engineering, Korea Advanced Institute of Science and Technology, Daejeon 34141, Korea
2
School of Mechanical Engineering, Dalian University of Technology, Dalian 116024, China
*
Author to whom correspondence should be addressed.
Appl. Sci. 2020, 10(11), 3676; https://doi.org/10.3390/app10113676
Submission received: 19 February 2020
/
Revised: 18 May 2020
/
Accepted: 20 May 2020
/
Published: 26 May 2020
(This article belongs to the Section Mechanical Engineering)
Abstract
:Helmholtz resonators (HR) have been proven to have feasibility for sensor applications with good performance. However, for biosensor application, when the amount of test sample is limited, the operating frequency tends to be very high, which may bring challenges of resonance excitation and frequency measurement. In this paper, a modified HR was proposed for biosensor application at a lower frequency, by designing the neck of the HR as a type of an Archimedes spiral, which can increase the neck length as much as possible without occupying much space. The resonant frequency of the proposed HR was derived by treating it as an HR with a straight neck with the equivalent length. An analytical example was calculated and verified by acoustic finite element analysis, and the results clearly showed that the frequency decreases in comparison to that of the conventional HR. Based on the underlying theory, the measurement principle was proposed and the experiment setup was established using a 3D-printed structure. The experiment was done using test solutions with different glucose concentrations, whose results showed consistency with the analytical results and noticeable frequency increases with the glucose concentration. Prospective results of the proposed HR after miniaturization show an operating frequency around 3 kHz when the amount of test sample is 0.1 mL, which will facilitate use of the common acoustic power source and acoustic pressure sensors in the sensing system.
1. Introduction
Over the past several decades, dynamic-mode cantilever sensors have been studied extensively with broad applications in various fields due to their fast response and low fabrication cost. In addition, with the development of microfabrication technology, high sensitivity and resolution are realized [1]. This kind of sensor mostly detects the resonant frequency shift induced only by the added mass effect, so sensitivity improvements are usually realized by decreasing the size or operating at higher order modes [2,3], which may bring manufacturing complexities and frequency measurement difficulties. To conquer these deficiencies, sensing architecture based on Helmholtz resonance was proposed in our previous paper as a new type of biosensor [4], which shows a higher sensitivity at a similar operating frequency compared with the sensor using a cantilever beam. However, when the amount of test sample is limited (which is common in biosensor application), the operating frequency tends to be much higher, which brings challenges in resonance excitation and frequency measurement. In this paper, we aim to design a new type of Helmholtz resonator (HR) to lower the resonant frequency.
Since the HR is known as an effective muffler, in the field of noise control in practical architecture or vehicle engineering, some research was carried out to lower the resonant frequency of HRs for better noise attenuation performance at low frequencies under a space restriction. Selamet and Lee [5] investigated the acoustic performance of HRs with an extended neck and found that the extension of the neck into the cavity can lower the resonant frequency without increasing the volume. Selamet et al. [6] then studied HRs with fibrous material and found that the acoustic performance can be modified considerably using the fibrous material without changing the cavity dimensions. Cheng et al. [7] constructed the low-frequency noise attenuation technology using HRs with horn-shaped necks. Shi and Mak [8] modified HRs using a spiral duct to lengthen the neck in a small space, showing that HRs with a spiral neck can achieve high noise attenuation performance at low frequencies. Cai et al. [9] compared the noise attenuation effect of an HR with an extended neck and an HR with a spiral neck and explained the potential application of these two neck types in noise control. Nudehi et al. [10] studied HRs with a flexible end plate and found that the flexible plate provided the modified HRs with multiple resonant frequencies, while the fundamental frequency went to a much lower frequency. Kurdi et al. [11] applied the multi-objective optimization procedure to HRs with a flexible end plate, which can produce a small volume HR capable of achieving high transmission loss across a specified frequency range. Li and Assouar [12] proposed a meta-surface composed of a perforated plate with a hole and a coiled air chamber, by which sound absorption could be achieved in a low frequency range. Chen and Park [13] proposed an HR with a flexible membrane on an elastic foundation for the measurement of the elastic coefficient of human skin. The elastic coefficient of human skin is related directly with the resonant frequency located between rigid HRs and HRs with a flexible membrane, by which the corresponding elastic coefficient value can be obtained.
In this paper, a modified Helmholtz resonator with an Archimedes spiral neck filled with two kinds of fluid was proposed for the measurement of the analyte concentration in aqueous solution at low frequency. The equivalent mass-spring system was used to predict the resonant frequency of an HR with a spiral neck, by treating the Archimedes spiral neck as a straight neck with the equivalent length. An analytical example was analyzed and verified by acoustic finite element analysis, and based on that, the measurement principle was proposed and the sensing system was established. As an example, test solutions with different glucose concentrations were made and measured by the established sensing system, showing good performance of the proposed method in measuring the analyte concentration at low frequency.
2. Material and Methods
2.1. The Underlying Theory
The modified Helmholtz resonator (HR) proposed in this paper is shown in Figure 1a. It consists of a cavity and a spiral neck with inlet and outlet. There are several well-known 2D spirals including Archimedes spirals, hyperbolic spirals, Theodorus spirals, Fibonacci spirals, Cornu spirals, etc. [14]. Among them, the neck of the proposed HR in this paper is designed along the Archimedes spiral, which is the trajectory of a point moving with constant velocity on a rotating straight line with constant angular velocity in the horizontal plane. Archimedes spirals are common in the natural world and widely used in practical applications such as the flat coil spring and the planar spiral coil [15,16]. There are some other spiral structures modified from the Archimedes spiral, such as the rectangular, hexagonal and octagonal spirals usually investigated as planar spiral inductors [17], which have discontinuities in their curvatures that may yield non-uniformity of velocity or acceleration of fluid moving inside. For the purposes of this paper, we needed a uniform cross-section, a smooth change of curvature as well as a long length of spiral defined in a 2D plane simultaneously. Considering the engineering restrictions mentioned above, the Archimedes spiral was selected in this paper. This kind of structure can be easily fabricated using 3D printing or etching techniques, which are common in the field of sensors. For the biosensor application, the HR was filled with two kinds of fluid, i.e., the fixed fluid and the test solution. This HR can be equivalent to an HR with a straight neck with sectional area , as shown in Figure 1b. The length of the neck filled with fixed fluid and test solution is marked as and , respectively.
For a small HR, a small volume usually corresponds to a large resonant frequency, but the frequency can be lowered by making the neck length much longer. For a small HR, the well-known frequency formula obtained using the classical mass-spring system was justified by Schweizer [18].
The proposed HR can be considered as a lumped mechanical system consisting of mass and spring, as shown in Figure 1b, to calculate the resonant frequency. The mass (m) of the equivalent mass-spring system can be obtained as
where is the density and is the equivalent length. The subscripts and indicate the fixed fluid and test solution, respectively. and are usually longer than and because of the radiation mass loadings. They can be computed as and , where and are the end correction lengths determined as , [19].
In a polar system , the Archimedes spiral can be expressed as and the arc length of the Archimedes spiral can be obtained by
where is the distance between the starting point and the origin of the polar coordinate system, and is the rotation radian of the spiral.
The stiffness (k) of the equivalent mass-spring system can be obtained by
Then, the resonant frequency can be calculated using
Thus, the HR functions as a muffler when it is linked to a duct as a side-branch (Figure 2), and the maximal noise attenuation will occur at the resonant frequency of the HR. The peak location of the spectrum of transmission loss (TL) indicates the resonant frequency. TL can be calculated directly using the difference of acoustic pressure levels at incident and transmitted end
where P1 and P2 are incident and transmitted acoustic pressures, respectively.
For the side-branch HR mounted on a duct, transmission loss can be calculated by
where is the cross-sectional area of the duct and is the acoustic impedance of HR, and it can be described as
where is the specific acoustic resistance, and it can be obtained as , is the wave number calculated by , and is the frequency of acoustic wave. The acoustic inertance and acoustic compliance are expressed by and , where is the bulk modulus of the test solution.
2.2. Effects of the Analyte Concentration on Density and Sound Speed
Equation (4) reveals the direct relationship of the resonant frequency with the density () and sound speed () of the test solution if other parameters are defined as constant values. Obviously, the density of the test solution will change with the analyte concentration. The effect of analyte concentration on sound speed in the test solution needs to be explained. The sound speed in glucose solution, as well as the density, was observed to increase as glucose concentration increased [20]. The adiabatic compressibility of the glucose solution () can be expressed as
where is the adiabatic compressibility of the water molecule and is the fractional volume of the glucose in the solution.
Then, the sound speed () in glucose solution can be calculated using [21]
Using Equations (8) and (9) and referring to the existing data in [21], sound speed in glucose solution with different glucose concentrations is calculated as shown in Table 1. The values of density are also listed in Table 1, which reveal that both the density and sound speed increase with higher glucose concentration.
2.3. Analytical Example and Finite Element Method(FEM) Simulation
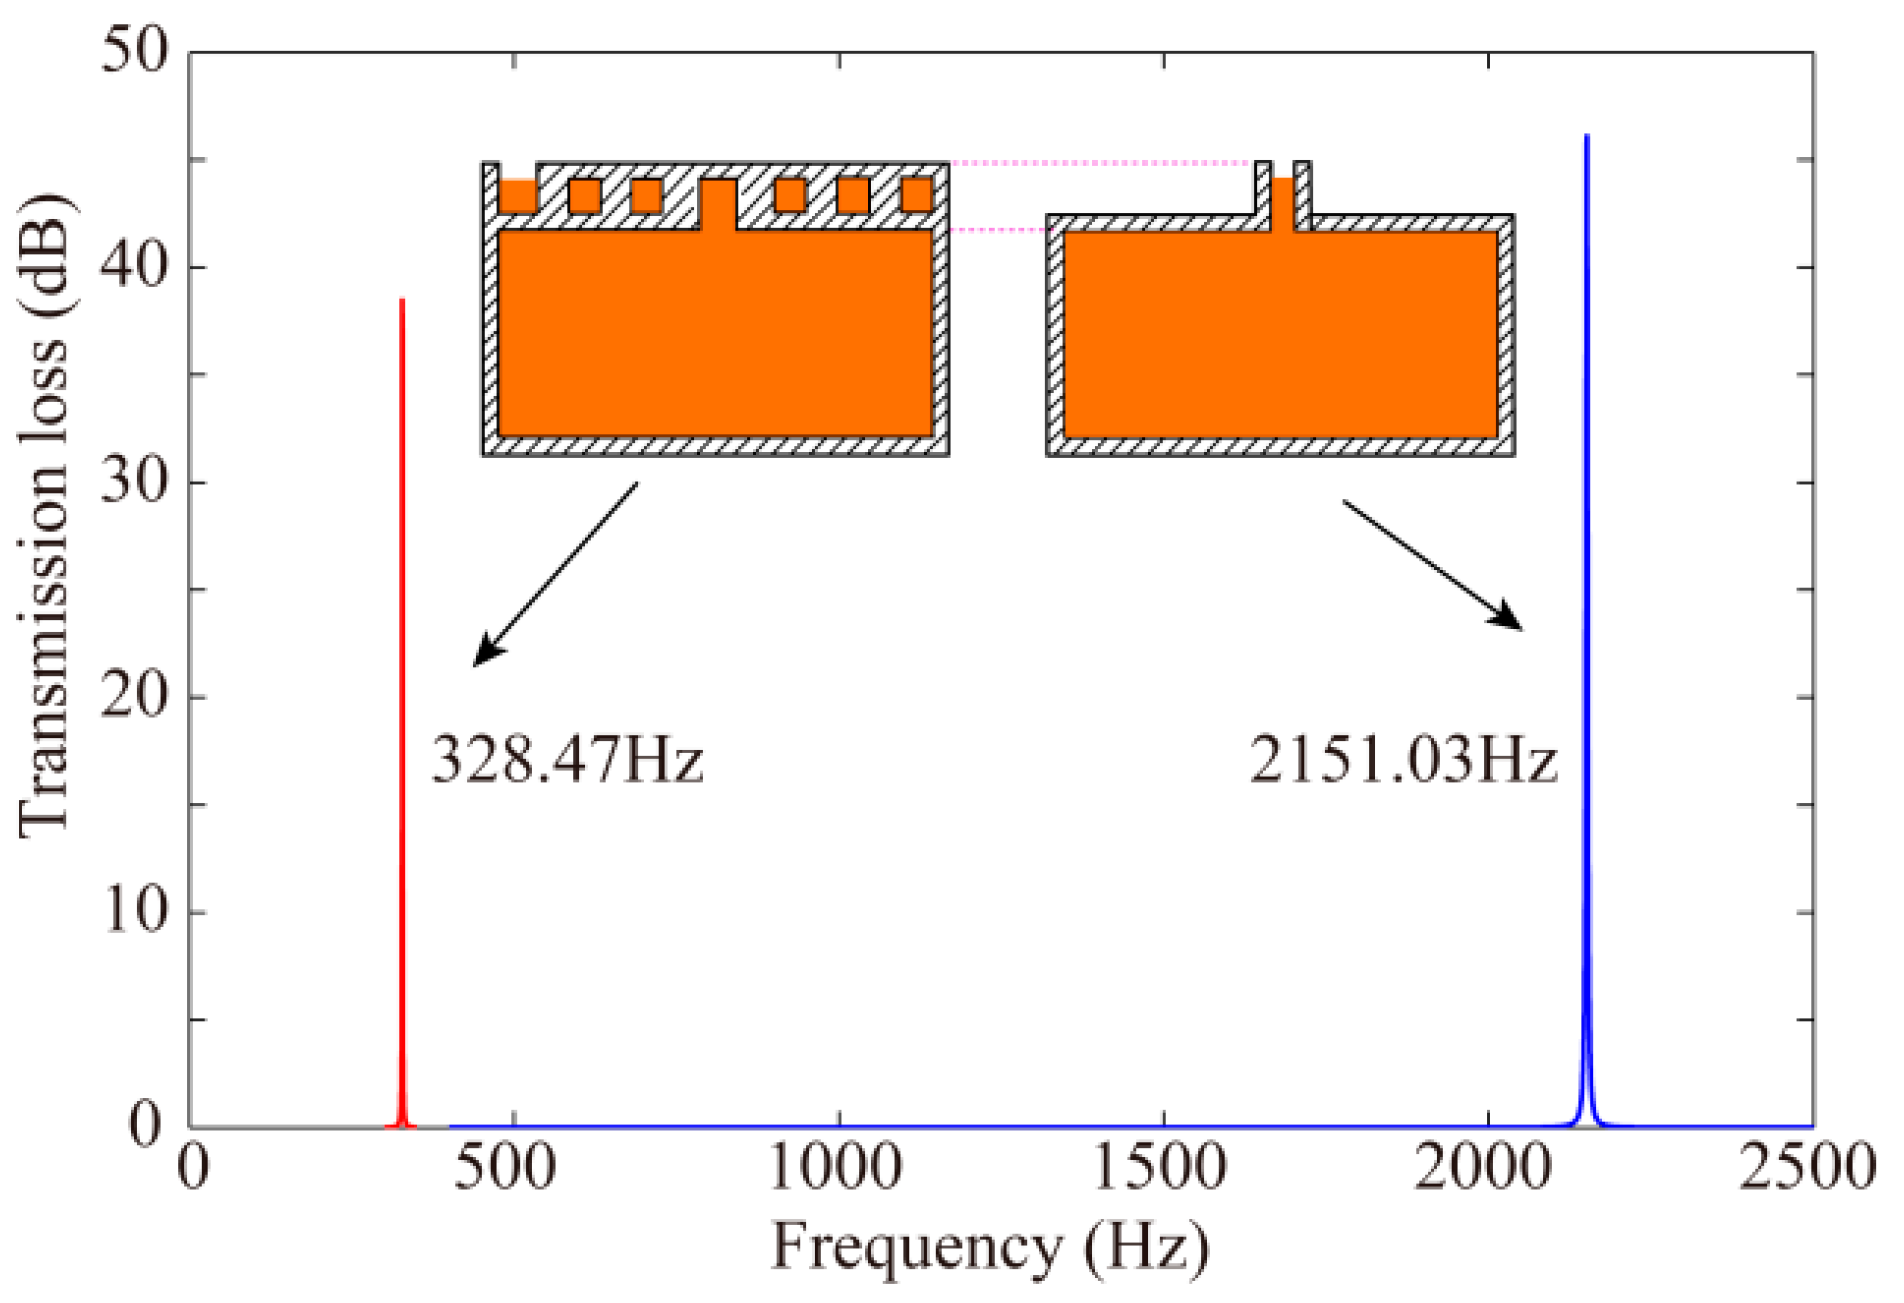
The value range of of the Archimedes spiral is selected as in the polar coordinate, and the arc length is obtained as . The geometrical parameters of the example HR corresponding to Figure 1b were listed as follows: , , and . All the walls of the duct, spiral neck and chamber are assumed to be rigid. The fixed fluid is selected as air and the test solution is selected as pure water as an example, which means that , . For comparison, a conventional HR which has the same cavity and the same height of neck as the proposed HR is designed. Spectra of the transmission loss for the two types of HR are shown in Figure 3 and were obtained by Equation (6).
As shown in Figure 3, the resonant frequencies are 328.47 and 2151.03 Hz, which means that the proposed HR can significantly lower the resonant frequency. In addition, the proposed HR narrows the resonance bandwidth compared with the conventional HR. This was mentioned in previous research [9] as the disadvantage of increasing neck length when the HR was applied for noise attenuation. In our research, however, only the resonant frequency was of concern, changing depending on the analyte concentration. The effect on bandwidth is not investigated as a key point in this paper. Even the sharp bandwidth can give a positive effect on reading the resonant frequency since it improves frequency resolution.
To investigate the characteristics of the proposed HR more intuitively, a finite element model was established utilizing LMS virtual.lab 10-SL1 (@Siemens PLM, Munich, German) for the same model whose parameters were shown previously, and corresponding acoustic finite element analysis was carried out. In the finite element model, only the fluid domain was concerned. This means that all the walls are considered as rigid. There are 74,574 elements (tetrahedron elements) in the model and all elements were set as acoustic elements. The established acoustic finite element model with which the acoustic mode analysis was carried out is shown in Figure 4a. The pressure distribution of the 1st mode is shown in Figure 4b, and the obtained resonant frequency is 325.08 Hz. It shows that under that mode, the acoustic pressures are concentrated on the HR, and it accounts for the mechanism of transmission loss of the duct with HR. The relative error between the analytical result using Equation (4) and the Finite Element Method (FEM) result is 1.03%, which means that the two resonant frequencies are quite close and the reasonability of the analytical derivation can be verified. The error of 1.03% may come from the error of actual spiral neck length in the analytical example and FEM simulation.
Then, based on the mode analysis results, acoustic response analysis was conducted by defining unit velocity with a frequency range of 310–350 Hz in the incident end. The other duct end was defined as an anechoic end. Acoustic pressure levels were acquired in the input and output end of the duct, and then the transmission loss could be obtained using Equation (5). Figure 5 shows the spectrum of transmission loss for the duct-HR system filled with 0 wt.% (water) and 5 wt.% glucose solution. It reveals that the peak of the transmission loss (indicating the resonant frequency of the proposed HR) shifts to a higher frequency with higher concentration. In Figure 5, two negative peaks (valleys) can be observed, and the valley frequency also shifts to a higher frequency. They are expected to occur from the other acoustic mode of the duct-HR system. In this paper, we are only concerned with the positive peaks which can be measured in the following experiment. Then, the measurement principle and device architecture can be proposed as shown in the next section.
2.4. Measurement Principle and Device Architecture
The measurement principle of using the proposed HR to measure analyte concentration is shown in Figure 6. The proposed HR is linked with a circular duct, where one end is equipped with an acoustic power source and the other end is defined as an anechoic end. Two microphones are used to obtain the P1 and P2 in Equation (5) before and after the neck inlet of the HR. Using the same HR dimensions as the analytical example, the architecture consisting of a duct (, ) linked with an HR was fabricated by 3D printing. The material of 3D printing was ABS (acrylonitrile butadiene styrene) resin. The walls were solid and wall thickness was 3 mm. A wireless speaker was selected as the acoustic power source, and two acoustic pressure sensors were placed to measure the acoustic pressures. The polyester fiber was used as an acoustic absorption material to cover the other end of the duct in order to make it into an approximately full acoustic absorption boundary. The absorption coefficient in the frequency range of 100–1000 Hz is larger than 0.92. The fixed fluid was selected as air.
3. Results and Discussion
For different glucose concentrations (0 wt.%, 5 wt.%, 10 wt.% and 15 wt.%), the average spectrum curves of the transmission loss obtained by three experiments are as shown in Figure 7a, which shows the increase of resonant frequency with the increase of glucose concentration. Gaussian fitting was used to get the smooth curve (Figure 7b), by which the value of resonant frequency can be identified as shown in Table 2. Analytical results are also listed in Table 2 for comparison. The relative errors between analytical results and experimental results varied from 0.09% to 1.89%, which showed quite close results. For practical use, it is better to carry out the calibration test for the practical structure and analyte concentrations, and the analytical values are just used as a design reference. Another obvious phenomenon observed is that the Q factor of the proposed sensing device is quite low, which may come from the surface roughness of the 3D-printed structure [22,23]. Another reason for the low Q factor is the imperfect sound reflection of the 3D-printed walls, which means that losses of acoustic power occur during the acoustic propagation. This work focuses on the location of the peak but not the magnitude of the peak, so the effect of surface roughness on the Q factor is not discussed in detail. In further studies, we will try to bring the analytical and numerical model much closer to the experimental system. We will further try to develop a more consummate experimental system for more reliable results of high quality.
In research on the resonant-type liquid density sensor [24], the absolute sensitivity of a sensor is defined as
and the relative sensitivity is defined as
where is the change of resonant frequency, is the density variation of test solution, f0 and are the fiducial values. For our proposed sensing devices, the absolute sensitivity obtained by experimental results is near the resonant frequency 328.5 Hz, and the relative sensitivity is . For the cantilevered sensors, which are based on the added mass effect of the test solution, the relative sensitivity is theoretically lower than 0.5 [25].
For practical biosensor applications, a test sample of about 10.5 mL in the present structure design is a rather large amount. For a tiny bit of solution, Table 3 shows the estimated results in the case of the test sample, obtained by analytical results. When the amount of the test sample is 0.1 mL after device miniaturization, the resonant frequency goes to 3377.4 Hz and the corresponding absolute sensitivity is 3.02 , which is higher than the previous micro-cantilever sensors at a similar frequency range. The frequency is relatively low, which locates it in the feasible range of conventional acoustic pressure sensors. When the amount of the test sample goes to 0.01 mL, the frequency goes to 28.5 kHz, but meanwhile, the sensitivity is about two times higher than that of the trapezoid cantilever beam using the 2nd mode.
The possible future application of the proposed HR is monitoring glucose levels of human blood. There are many other substances in human blood (e.g., fat, cholesterol) and they all ineluctably have an impact on resonant frequency. However, glucose concentration changes greatly just before and after meals. The glucose concentration in human blood varies significantly over the short term, so it can be modeled as the aqueous solution mentioned above. This means that sensor calibration is needed regularly (e.g., once a week). In this paper, underlying theory, principle and architecture based on a modified HR were proposed for application as a biosensor. As future work, miniaturization, integration and further optimization will be done for practical applications.
4. Conclusions
A modified Helmholtz resonator with an Archimedes spiral neck filled with two kinds of fluid was proposed in this paper, for the analyte concentration measurement in aqueous solution at low frequency. The equivalent mass-spring system was used to predict the resonant frequency of the proposed HR, by treating the Archimedes spiral neck as a straight neck with the equivalent length. An analytical example was analyzed and verified by acoustic finite element analysis. The resonant frequency of the proposed HR is much lower than that of the conventional HR. Based on the underlying theory, analytical example and FEM verification, a measurement principle was proposed and a sensing system was established. The test solutions with different glucose concentrations were made and measured by the established sensing system. The results showed good performance of the proposed method for measuring the analyte concentration for biosensor application at low frequency. Analytical results after the expected miniaturization show the good performance of “low frequency and high sensitivity” of the proposed Helmholtz resonator.
Author Contributions
Conceptualization, Y.C. and Y.-H.P.; methodology, Y.C.; software, Y.-H.P.; validation, Y.C. and Y.-H.P.; formal analysis, Y.C.; investigation, Y.C. and B.L.; resources, Y.-H.P.; data curation, Y.C.; writing—original draft preparation, Y.C.; writing—review and editing, Y.-H.P. and B.L.; visualization, Y.C.; supervision, Y.-H.P.; project administration, Y.-H.P.; funding acquisition, Y.H.P. All authors have read and agreed to the published version of the manuscript.
Funding
This work was supported by the “Human Resources Program in Energy Technology” of the Korea Institute of Energy Technology Evaluation and Planning (KETEP), granted financial resources from the Ministry of Trade, Industry & Energy, Republic of Korea. (No.20204030200050) and the BK21 plus program of the Ministry of Education, Republic of Korea.
Acknowledgments
The authors would like to acknowledge the help of Jae-Duck Lee for the fabrication of the Helmholtz resonator using a 3D printer.
Conflicts of Interest
The authors declare no conflict of interest.
References
- Alvarez, M.; Lechuga, L.M. Microcantilever-based platforms as biosensing tools. Analyst 2010, 135, 827–836. [Google Scholar] [CrossRef] [PubMed]
- Ricciardi, C.; Fiorilli, S.; Bianco, S.; Canavese, G.; Castagna, R.; Ferrante, I.; Digregorio, G.; Marasso, S.L.; Napione, L.; Bussolino, F. Development of microcantilever-based biosensor array to detect angiopoietin-1, a marker of tumor angiogenesis. Biosens. Bioelectron. 2010, 25, 1193–1198. [Google Scholar] [CrossRef] [PubMed]
- Okan, M.; Sari, E.; Duman, M. Molecularly imprinted polymer based micromechanical cantilever sensor system for the selective determination of ciprofloxacin. Biosens. Bioelectron. 2017, 88, 258–264. [Google Scholar] [CrossRef] [PubMed]
- Chen, Y.; Park, Y.-H. Measurement of an Analyte Concentration in Test Solution by Using Helmholtz Resonator for Biosensor Applications. Sensors 2019, 19, 1127. [Google Scholar] [CrossRef] [PubMed] [Green Version]
- Selamet, A.; Lee, I. Helmholtz resonator with extended neck. J. Acoust. Soc. Am. 2003, 113, 1975–1985. [Google Scholar] [CrossRef] [PubMed]
- Selamet, A.; Xu, M.B.; Lee, I.J.; Huff, N.T. Helmholtz resonator lined with absorbing material. J. Acoust. Soc. Am. 2005, 117, 725–733. [Google Scholar] [CrossRef] [Green Version]
- Cheng, X.; Chen, X.; Rong, J.; Fan, B. Low-Frequency Noise Reduction of Rocket Fairings Using Horn-Shaped-Neck Helmholtz Resonators. J. Spacecr. Rocket. 2018, 56, 273–282. [Google Scholar] [CrossRef]
- Shi, X.; Mak, C.M. Helmholtz resonator with a spiral neck. Appl. Acoust. 2015, 99, 68–71. [Google Scholar] [CrossRef]
- Cai, C.; Mak, C.M.; Shi, X. An extended neck versus a spiral neck of the Helmholtz resonator. Appl. Acoust. 2017, 115, 74–80. [Google Scholar] [CrossRef]
- Nudehi, S.S.; Duncan, G.S.; Farooq, U. Modeling and experimental investigation of a Helmholtz resonator with a flexible plate. J. Vib. Acoust.-Trans. ASME 2013, 135, 041102. [Google Scholar] [CrossRef]
- Kurdi, M.H.; Duncan, G.S.; Nudehi, S.S. Optimal design of a Helmholtz resonator with a flexible end plate. J. Vib. Acoust. 2014, 136, 031004. [Google Scholar] [CrossRef]
- Li, Y.; Assouar, B.M. Acoustic metasurface-based perfect absorber with deep subwavelength thickness. Appl. Phys. Lett. 2016, 108, 063502. [Google Scholar] [CrossRef]
- Chen, Y.; Park, Y.-H. A Helmholtz resonator on elastic foundation for measurement of the elastic coefficient of human skin. J. Mech. Behav. Biomed. Mater. 2020, 101, 103417. [Google Scholar] [CrossRef] [PubMed]
- Spiral. Available online: https://en.wikipedia.org/wiki/Spiral#Two-dimensional,Wikipedia (accessed on 10 November 2019).
- Hooker, J.; Ramaswamy, V.; Arora, R.; Edison, A.; Withers, R.; Nast, R.; Brey, W. An empirical expression to predict the resonant frequencies of archimedean spirals. IEEE Trans. Microw. Theory Tech. 2015, 63, 2107–2114. [Google Scholar] [CrossRef]
- Maleeva, N.; Averkin, A.; Abramov, N.N.; Fistul, M.V.; Karpov, A.; Zhuravel, A.P.; Ustinov, A.V. Electrodynamics of planar Archimedean spiral resonator. J. Appl. Phys. 2015, 118, 033902. [Google Scholar] [CrossRef] [Green Version]
- Zhao, J. A new calculation for designing multilayer planar spiral inductors. EDN (Electr. Des. News) 2010, 55, 37–40. [Google Scholar]
- Schweizer, B. The low-frequency spectrum of small Helmholtz resonators. Proc. R. Soc. A-Math. Phys. Eng. Sci. 2015, 471, 20140339. [Google Scholar] [CrossRef]
- Kela, L. Resonant frequency of an adjustable Helmholtz resonator in a hydraulic system. Arch. Appl. Mech. 2009, 79, 1115–1125. [Google Scholar] [CrossRef]
- Zhao, S.; Tao, W.; He, Q.; Zhao, H.; Cao, W. A non-invasive photoacoustic and ultrasonic method for the measurement of glucose solution concentration. AIP Adv. 2017, 7, 035313. [Google Scholar] [CrossRef] [Green Version]
- Pryor, A.W.; Roscoe, R. The velocity and absorption of sound in aqueous sugar solutions. Proc. Phys. Soc. 1954, 67, 70–81. [Google Scholar] [CrossRef]
- Pritz, B.; Magagnato, F.; Gabi, M. Investigation of the Effect of Surface Roughness on the Pulsating Flow in Combustion Chambers with LES; Springer Proceedings in Physics; Springer: Berlin/Heidelberg, Germany, 2008. [Google Scholar]
- Yuvaraj, L.; Jeyanthi, S.; Chinnapandi, M.; Babu, L. Sound Absorption of Multilayer Micro Perforated Panel with Helmholtz Resonator Mount. In Proceedings of the INTER-NOISE and NOISE-CON Congress and Conference Proceedings, Madrid, Spain, 16–19 June 2019; Volume 259, pp. 4002–4009. [Google Scholar]
- Zhao, L.; Hu, Y.; Hebibul, R.; Xia, Y.; Huang, L.; Zhao, Y.; Jiang, Z. Density measurement sensitivity of micro-cantilevers influenced by shape dimensions and operation modes. Sens. Actuator B Chem. 2017, 245, 574–582. [Google Scholar] [CrossRef]
- Zhao, C.; Montaseri, M.H.; Wood, G.S.; Pu, S.H.; Seshia, A.A.; Kraft, M. A review on coupled MEMS resonators for sensing applications utilizing mode localization. Sens. Actuator A Phys. 2016, 249, 93–111. [Google Scholar] [CrossRef]
Figure 1.
The proposed Helmholtz resonator (HR) partially filled with test solution. (a) Structure of the proposed HR; (b) the equivalent HR and corresponding mass-spring system.
Figure 1.
The proposed Helmholtz resonator (HR) partially filled with test solution. (a) Structure of the proposed HR; (b) the equivalent HR and corresponding mass-spring system.

Figure 2.
Duct linked with a Helmholtz resonator as side-branch.

Figure 3.
Resonant frequency of the proposed HR and conventional HR.

Figure 4.
Acoustic finite element model and the 1st mode. (a) Acoustic finite element model; (b) pressure distribution of the 1st mode.
Figure 4.
Acoustic finite element model and the 1st mode. (a) Acoustic finite element model; (b) pressure distribution of the 1st mode.

Figure 5.
Spectrum of transmission loss obtained by acoustic response analysis using Finite Element Method (FEM).
Figure 5.
Spectrum of transmission loss obtained by acoustic response analysis using Finite Element Method (FEM).

Figure 6.
Schematic of the measurement principle and the experiment setup.

Figure 7.
Spectrum of transmission loss obtained by experiment. (a) Original results (average curves); (b) fitting results.
Figure 7.
Spectrum of transmission loss obtained by experiment. (a) Original results (average curves); (b) fitting results.


Table 1.
Density and sound speed at different glucose concentration.
| Glucose Concentration | Density (kg/m3) | Sound Speed (m/s) |
|---|---|---|
| 0 wt.% (Water) | 998 | 1481.5 |
| 5 wt.% | 1010.5 | 1498.1 |
| 10 wt.% | 1023.8 | 1518.5 |
| 15 wt.% | 1038.0 | 1543.6 |
Table 2.
Resonant frequencies obtained by analytical and experiment approaches.
| Glucose Concentration | 0 wt.% | 5 wt.% | 10 wt.% | 15 wt.% |
|---|---|---|---|---|
| Analytical results (A) | 328.5 Hz | 332.1 Hz | 336.6 Hz | 342.1 Hz |
| Experiment results (B) | 326.5 Hz | 332.9 Hz | 336.3 Hz | 348.7 Hz |
| Standard deviations (C) | 1.13 | 1.21 | 1.15 | 1.32 |
| Relative error (|A − B|/B ∗ 100%) | 0.61% | 0.24% | 0.09% | 1.89% |
Table 3.
Estimated frequencies and sensitivities of the miniaturized device (analytical results).
| Test Sample Amount | 0.1 mL | 0.1 mL | 0.01 mL |
|---|---|---|---|
| This Paper | Reference [4] | This Paper | |
| Resonant frequency | 3377.4 Hz | 134.8 kHz | 28.5 kHz |
| Sensitivity | 3.02 | 299.2 | 25.52 |
| Cantilever sensor [24] | Rectangle 1.9 mm (1st mode) | Trapezoid 1.5 mm (2nd mode) | |
| Resonant frequency | 3747.245 Hz | 29.1 kHz | |
| Sensitivity | 2.154 | 13.801 |
© 2020 by the authors. Licensee MDPI, Basel, Switzerland. This article is an open access article distributed under the terms and conditions of the Creative Commons Attribution (CC BY) license (http://creativecommons.org/licenses/by/4.0/).
Share and Cite
MDPI and ACS Style
Chen, Y.; Lee, B.; Park, Y.-H. A Helmholtz Resonator with Spiral Neck for Analyte Concentration Measurement in Low Frequency Range. Appl. Sci. 2020, 10, 3676. https://doi.org/10.3390/app10113676
AMA Style
Chen Y, Lee B, Park Y-H. A Helmholtz Resonator with Spiral Neck for Analyte Concentration Measurement in Low Frequency Range. Applied Sciences. 2020; 10(11):3676. https://doi.org/10.3390/app10113676
Chicago/Turabian StyleChen, Yugang, Bomi Lee, and Yong-Hwa Park. 2020. "A Helmholtz Resonator with Spiral Neck for Analyte Concentration Measurement in Low Frequency Range" Applied Sciences 10, no. 11: 3676. https://doi.org/10.3390/app10113676
Note that from the first issue of 2016, this journal uses article numbers instead of page numbers. See further details here.