
Strengthening Taiwan’s Green Building Certification System from Aspects of Productivity and Energy Costs to Provide a Healthier Workplace


1
Department of Industrial Technology Education, National Kaohsiung Normal University, Kaohsiung 824004, Taiwan
2
Department of Architecture, National Cheng Kung University, Tainan 70101, Taiwan
3
Department of Bioenvironmental Systems Engineering, National Taiwan University, Taipei 10617, Taiwan
*
Author to whom correspondence should be addressed.
Atmosphere 2022, 13(1), 118; https://doi.org/10.3390/atmos13010118
Submission received: 8 November 2021
/
Revised: 9 January 2022
/
Accepted: 10 January 2022
/
Published: 12 January 2022
(This article belongs to the Special Issue Environmental and Energy Assessment of Buildings and Systems)
Abstract
:This study estimates the relationship between poor indoor environmental quality (IEQ) and the increasing labor costs in green buildings in Taiwan. Specifically, poor performance of IEQ including HVAC, lighting, and indoor air quality, influences the health and well-being of occupants and leads to worse productivity, ultimately causing increased personnel cost. In Taiwan’s green building certification (GBC) system, the energy-savings category is mandatory while the IEQ category is only optional. It means that certified building cases may not reach the expected level in IEQ. Thus, this study reviews the thermal environment, indoor air quality (IAQ), and illumination performances of IEQ-certified and non-IEQ-certified buildings in 20 green buildings. Building energy and IEQ simulations were conducted to analyze the relationships between indoor comfort, energy cost, and personnel cost in green buildings. The results show that IEQ-certified green buildings averagely perform better than non-IEQ-certified ones in the aspects of IEQ and building costs. Besides, 3 of 13 non-IEQ-certified green buildings undertake extremely high additional expenditure for the poor IEQ. The results correspond to some previous findings that green-certified buildings do not necessarily guarantee good building performance. This study further inspects the pros and cons of Taiwan’s GBC system and proposes recommendations against its insufficient IEQ evaluation category. As the trade-off of energy-saving benefits with health and well-being in green buildings has always been a concern, this study aims to stimulate more quantitative research and promote a more comprehensive green building certification system in Taiwan.
1. Introduction
Since people spend at least 87% of their lifetime [1] and consume about 40% of global energy in buildings [2], the concern regarding balancing human well-being and energy efficiency is necessary [3,4]. The concept of green buildings (GBs), focusing on the practice of creating healthier and resource-efficient building environments [5,6], is regarded as an effective solution to improve the building performance [7]. Therefore, many countries have developed green building certifications (GBCs) to ensure a building’s performance regarding energy conservation and indoor environmental quality (IEQ) [8,9,10].
The issues of IEQ in relation to indoor human health and comfort include acoustic quality [11,12], illumination [13,14], indoor air quality (IAQ) [15,16], and thermal comfort [17,18]. In addition to cutting down building energy consumption [19,20], GBs are also expected to improve the performance of IEQ and well-being [21,22]. The criteria for IEQ levels and energy performance in buildings refer to international standards, such as ISO 17772-1 [23] and EN 16798-1 [24]. However, the favoring of energy-saving benefits in the building industry means the human well-being category in GBs has received relatively less attention [25]. According to previous research, most GBs have outstanding energy efficiency and save 30–50% of energy consumption on average [26]; on the other hand, the human well-being category only accounts for 18–35% of the allocation, which is lower than 20–42% of the energy category [27].
To identify whether GBs possess better IEQ performance and satisfaction, this paper reviews the previous studies on IEQ, human health, and productivity performance between GBs and conventional buildings (CBs) that are not certified by GBCs. The GBCs considered in the review include: the Building Research Establishment Environmental Assessment Method (BREEAM) of the UK; the Leadership in Energy and Environmental Design (LEED) of the US; the Ecology, Energy saving, Waste reduction, and Health (EEWH) of Taiwan; the Korean Green Building Certification Criteria (KGBCC) of South Korea; the Green Star of Australia; the Green Mark of Singapore; China Green Building Label (CGBL) of China; and the Green Star of South Africa (GreenStar SA). A summary of the literature review is listed in Table 1.
Some of the studies indicated that GBs have a better performance than CBs. Pei et al. [28] measured IEQ variables and questionnaires in 10 CGBL buildings and 42 CBs in China. The results claimed that GBs performed better than CBs in all IEQ aspects. Sediso and Lee [29] implemented a post-occupancy evaluation of two KGBCC GBs and two CBs in South Korea. The results implied that GBs showed high satisfaction and enhanced IEQ performance. MacNaughton et al. [30] recruited 109 participants from 6 LEED GBs and 4 CBs in US cities. The findings showed that the LEED certification increased the benefits of most IEQ aspects, health, and productivity in high-performing buildings. Xuan [31] compared five LEED-certified buildings and one non-certified building in the US. The results showed that LEED GBs were superior to CBs in most IEQ factors. Lee et al. [32] carried out questionnaires and IEQ measurements in eight Green Mark GBs and six CBs in Singapore. The results showed that the mean ratings for satisfaction with thermal comfort, lighting level, IAQ, and overall IEQ were higher in Green Mark GBs.
Nevertheless, some studies found inconsistent results against the above ones. Lee and Kim [33] compared occupants’ satisfaction and performance between LEED and non-LEED buildings. This study found higher satisfaction and performance in thermal comfort and IAQ but lower visual and acoustic quality in LEED buildings. Paul and Taylor [34] investigated one GB and two CBs on campuses in Australia. The results revealed that there was no obvious difference between the two types of buildings in most IEQ aspects and further indicated that there was no evidence to show that GBs are more comfortable than CBs. Gou et al. [35] analyzed the IEQ performance of two LEED GBs and a group of CBs in Hong Kong. The results demonstrated an inconsistent IEQ performance in LEED buildings and suggested that there was no significant difference in IEQ satisfaction between the two groups. Gou et al. [36] examined the building performance and satisfaction in an LEED GB, a CGBL GB, and a CB in China. The in-depth examination of IEQs showed that GBs did not always perform better in each IEQ aspect than CB. Altomonte and Schiavon [37] collected questionnaires on 144 buildings, including 65 LEED GBs, in the United States. The results showed a negligible difference in IEQ satisfaction scores between the two groups of buildings. Liang et al. [38] surveyed IEQ performance and satisfaction in two CBs and three EEWH GBs in Taiwan. Although GBs performed better than CBs in all IEQ aspects, the two types of buildings were both low in thermal comfort and IAQ performance. Thatcher and Milner [39] compared the work environment between three Green Star buildings and a group of CBs in South Africa. This study noted that there were no statistically significant improvements for IEQ in theGBs except for IAQ. Altomonte et al. [40] gathered occupants’ responses from two BREEAM GBs and two CBs in the United Kingdom. The results showed that occupants had lower satisfaction regarding the luminous, aural, and thermal environments in BREEAM GBs. Sant’Anna et al. [41] administered questionnaire surveys to bank employees and customers in three LEED GBs and three CBs in Brazil. The results indicated that only the employees showed better IEQ satisfaction in the two groups of buildings.
This literature review illustrates equivocal outcomes of IEQ performance and occupant satisfaction in GBs. The comparative analysis in Table 1 implies that GBs may not always perform better in every aspect of IEQ and human satisfaction than that of CBs. The IEQ aspects should be emphasized more in GBCs to approach the expected performance of human comfort, well-being, and productivity originating from GBs’ design [16,25,35,40,42,43,44].
In Taiwan, the local certification of EEWH is one of the first GBCs in Asia [45,46]. Nine categories comprise the EEWH certification system, which include biodiversity, greenery, water-soil content, energy savings, CO2 emission reduction, construction waste reduction, IEQ, water resource, and garbage/sewage improvement. EEWH greatly focuses on the energy savings category (accounting for 28% of the allocation), which is listed as the mandatory inspection. Meanwhile, the IEQ category related to health and well-being accounts for only 12% of the allocation and is only listed as an optional inspection, which means that the IEQ category is not necessarily checked for every certified building [46]. Even if the IEQ design of a GB is poor, EEWH may not be able to identify or correct it in time to ensure the occupants’ health and comfort. As of October 2021, only 34% of the EEWH-certified buildings took the rank of the IEQ category [47]. In other words, 66% of the certified cases do not undergo the inspection or guarantees of the IEQ category. A local study [38] measured the IEQ and satisfaction of green offices in Taiwan. The results point out that warm, humid, stuffiness, and peculiar odor are the top four reasons that occupants complain about the poor IEQ in both GBs and CBs, although the proportions of satisfaction in the acoustics, lighting, thermal comfort, IAQ, and overall IEQ in GBs are higher than those in CBs. This study also demonstrated that it is necessary to re-examine the current evaluation criteria, especially regarding the incorporation of the criteria with relevance to thermal comfort. This indicated that when designers encounter the trade-offs between energy conservation and human comfort, the evaluation standard of the current EEWH certification system makes designers take the energy savings category into primary consideration, and the issue of IEQ is ignored intentionally or unintentionally.
From the forecited studies, it is difficult to conclude that a GB can certainly provide a better environment. The higher-weighted energy-saving benefits in most GBCs are not the only inducement of this status [25,26], whereas IEQ design inaccuracies or flawed evaluation criteria in GBCs have greater negative outcomes [48,49]. Building design and specifications should pay attention to the comfort demands of occupants and should not excessively pursue energy efficiency at the sacrifice of human comfort [50,51]. Specific evidence shows that building performance and IEQ have significant influences on human health, comfort, and productivity [52]. The loss in productivity that is avoided by maintaining a comfortable environment will far exceed the additional investment in environmental control [4]. In GB design, considering IEQ and human comfort can specifically result in additional benefits other than energy conservation. Therefore, it is essential to review the scoring systems of GBCs to further develop the GB concept, which considers energy conservation with human comfort, health, and well-being simultaneously [53,54].
Inspired by the trend of IEQ and human-related issues of GBs, this study aimed to explore the deficiencies of EEWH in IEQ inspection, with subsequent influences on energy consumption, human comfort, and productivity. This study conducted a comprehensive analysis of building designs for the selected EEWH GBs. Besides, building energy and indoor environment simulations were executed. Furthermore, the expenses of energy consumption related to heating ventilation and air-conditioning (HVAC) systems and occupants’ productivity gains and losses were estimated to observe how the IEQ category in EEWH influences the performance of the investigated cases. Ultimately, recommendations for complementing the IEQ category in the EEWH based on the findings of the relationship between energy consumption, expenditure, and IEQ performance are proposed in this study.
2. Materials and Methods
2.1. Investigated Cases
The investigated cases included 20 green buildings located in Taiwan, certified by EEWH after 2010, and the certification metadata is approved for public access. The relevant information is compiled in Table 2. Since this study focused on the aspects of energy consumption, occupants’ satisfaction, and gains and losses of productivity in green offices, only the scores related to the categories of energy savings and IEQ are listed in Table 2. The energy savings category is mandatory while the IEQ category is optional in the EEWH certification system. All 20 cases were office buildings that have had their energy conservation validated. The energy performances of these cases are around 20–75% of the average value in Taiwanese buildings. However, only seven cases have applied and passed the IEQ category. Due to an inability to obtain the IEQ verification data for the other 13 cases, it was not possible to estimate their rating scores. Besides, lack of IEQ verification does not necessarily mean that such cases’ performance in IEQ is worse.
A brief introduction to the scoring of the energy-savings category and IEQ category in the EEWH GBC system is given in the following paragraphs. On the one hand, the energy-savings score (R1) includes three aspects: envelope thermal performance (R11), HVAC system efficiency (R12), and lighting system efficiency (R13). All of the three aspects must meet the qualification benchmark to calculate the rating scores.
Table 3 shows the schemes for the three aspects of the R1 rating scores. Firstly, the R11 scoring focuses on lowering the external heat gain from the building envelope and reducing the solar heat gain from fenestrations. Secondly, the R12 scoring aims to prevent an excessive design of the HVAC system and encourages high-efficiency equipment as well as energy-saving technologies adopted in GBs. Thirdly, R13 scoring encourages the adoption of high-efficiency lighting devices/controls and prevents the excessive design of artificial illumination in GBs. Each aspect takes a basis value for estimating the rating score: the R11 basis is the ratio of the sensible cooling load (EEV); the R12 basis is the value of the HVAC system efficiency (EAC); the R13 basis is the value of the lighting system efficiency (EL). The qualification benchmark for these basis values is a value of 0.8. This means the proposed sensible cooling load from the building envelope (related to R11) and energy consumption of the HVAC system (related to R12) and lighting system (related to R13) must be 20% lower than the threshold values specified by EEWH. Meanwhile, there are upper limits for the three aspects and the total R1 scoring.
On the other hand, the IEQ category is composed of four aspects: acoustics, lighting, ventilation, and room furnishing. Table 4 depicts the evaluation contents, allocation, and weight for each aspect. The IEQ score (R2) is determined according to the rating score of each aspect (Xi) and the corresponding weighting factor (Yi), as Equations (1) and (2):
2.2. IEQ Impacts on Labor Cost
Generally, improving IAQ and thermal and visual comfort in green offices can increase productivity and generate extra profits to offset the higher energy expenditure. If productivity is lowered due to poor IEQ, it will take increased labor or time to complete the same workload [4]. Therefore, the loss of productivity, the man-hour increase, or additional personnel costs derived from the poor IEQ are classified as the cost of IEQ (CIEQ).
Jin et al. [55] proposed a method to deduce CIEQ, as shown in Equation (3). The value h is the hour number of a year; SPmax is the occupant’s maximum self-assessed productivity and SPh is the occupant’s self-assessed productivity at hour h; S is the average hourly salary; Nh is the number of occupants (N) at hour h; and wh is the weight of the occupancy during hour h:
The occupant’s self-assessed productivity (SP) is calculated by the IEQ satisfaction (IES) in Equation (4) [55,56]. In addition, IES can be derived by the relationship between IES and IEQ acceptance (IEQaccept.) in Equation (5), as proposed by Jin et al. [57]:
Through regression analysis of questionnaire data, Wong et al. [58] established empirical relationships for IEQaccept. with the predicted percentage of dissatisfied (PPD, ξ1), CO2 concentration (ξ2), equivalent noise level (ξ3), and illumination level (ξ4) in Equations (6)–(10):
where φ1–φ4 are the acceptances for the IEQ aspects of thermal, ventilation, acoustics, and lighting, respectively.
2.3. Research Agenda and Analysis Process
Through the simulation results of energy consumption from HVAC and lighting system and the IEQ performance in the investigated cases, this study analyzed the influences of energy-savings and IEQ categories in EEWH on energy expenses and IEQ costs, respectively. To emphasize the aforementioned influences, this study only considered the building costs related to IEQ expenditure, energy consumption of HVAC, and lighting systems. Figure 1 shows a flowchart that demonstrates the research agenda and analysis process of this study. The first step is to collate the information and metadata of the building envelope, HVAC system, and lighting system for each case. Secondly, the metadata is converted to the input format of the EnergyPlus software. EnergyPlus is a holistic modeling tool used to efficiently simulate the environmental and energy behavior of buildings and has been used in many sustainable building studies [59]. Then, hourly simulations of the building environment and energy consumption are executed with typical weather year data (TMY3) [60]. The third step is to estimate the energy cost (CE). According to EEWH, CE refers to the energy cost of the HVAC system and lighting equipment in the building, excluding other equipment. Meanwhile, the electricity-billing scheme of the Taiwan power company is imported into EnergyPlus for energy expenses estimation and CE calculation. The fourth step is the calculation of CIEQ. According to the simulation outcomes, the hourly indoor environmental conditions in each case can be acquired, including PPD, illumination, and CO2 concentration. Substituting these outcomes into Equations (6)–(10) obtains the IEQ variables of the thermal, lighting, acoustics, and IAQ aspects, as well as overall IEQ satisfaction. Lastly, this study can quantify the buildings’ economic costs and benefits derived from IEQ performance through Equations (3)–(5). In addition, there are some preconditions for the building simulations in this study. The acoustic environment, which cannot be simulated by EnergyPlus and is not feasible for performing long-term measurements, is assumed to be a constant level of ξ3 = 55 dBA (φ3 = 95%). The assumption is equivalent to a quiet office with some conversations and sounds of typing. Moreover, the lower and upper limits of SP according to Equation (4) are respectively 60.4% and 90.6%, so the maximum productivity in this study was set as SPmax = 90.6% [55]. The average value of the hourly salary refers to NT$260 announced by the Taiwan government. The occupancy density is 0.1 person/m2, and occupants work from 9:00 to 17:00 on weekdays. The daily expense of each building case is the sum of its CE and CIEQ in this study.
3. Results
3.1. Energy Costs and R1 Scores in EEWH Buildings
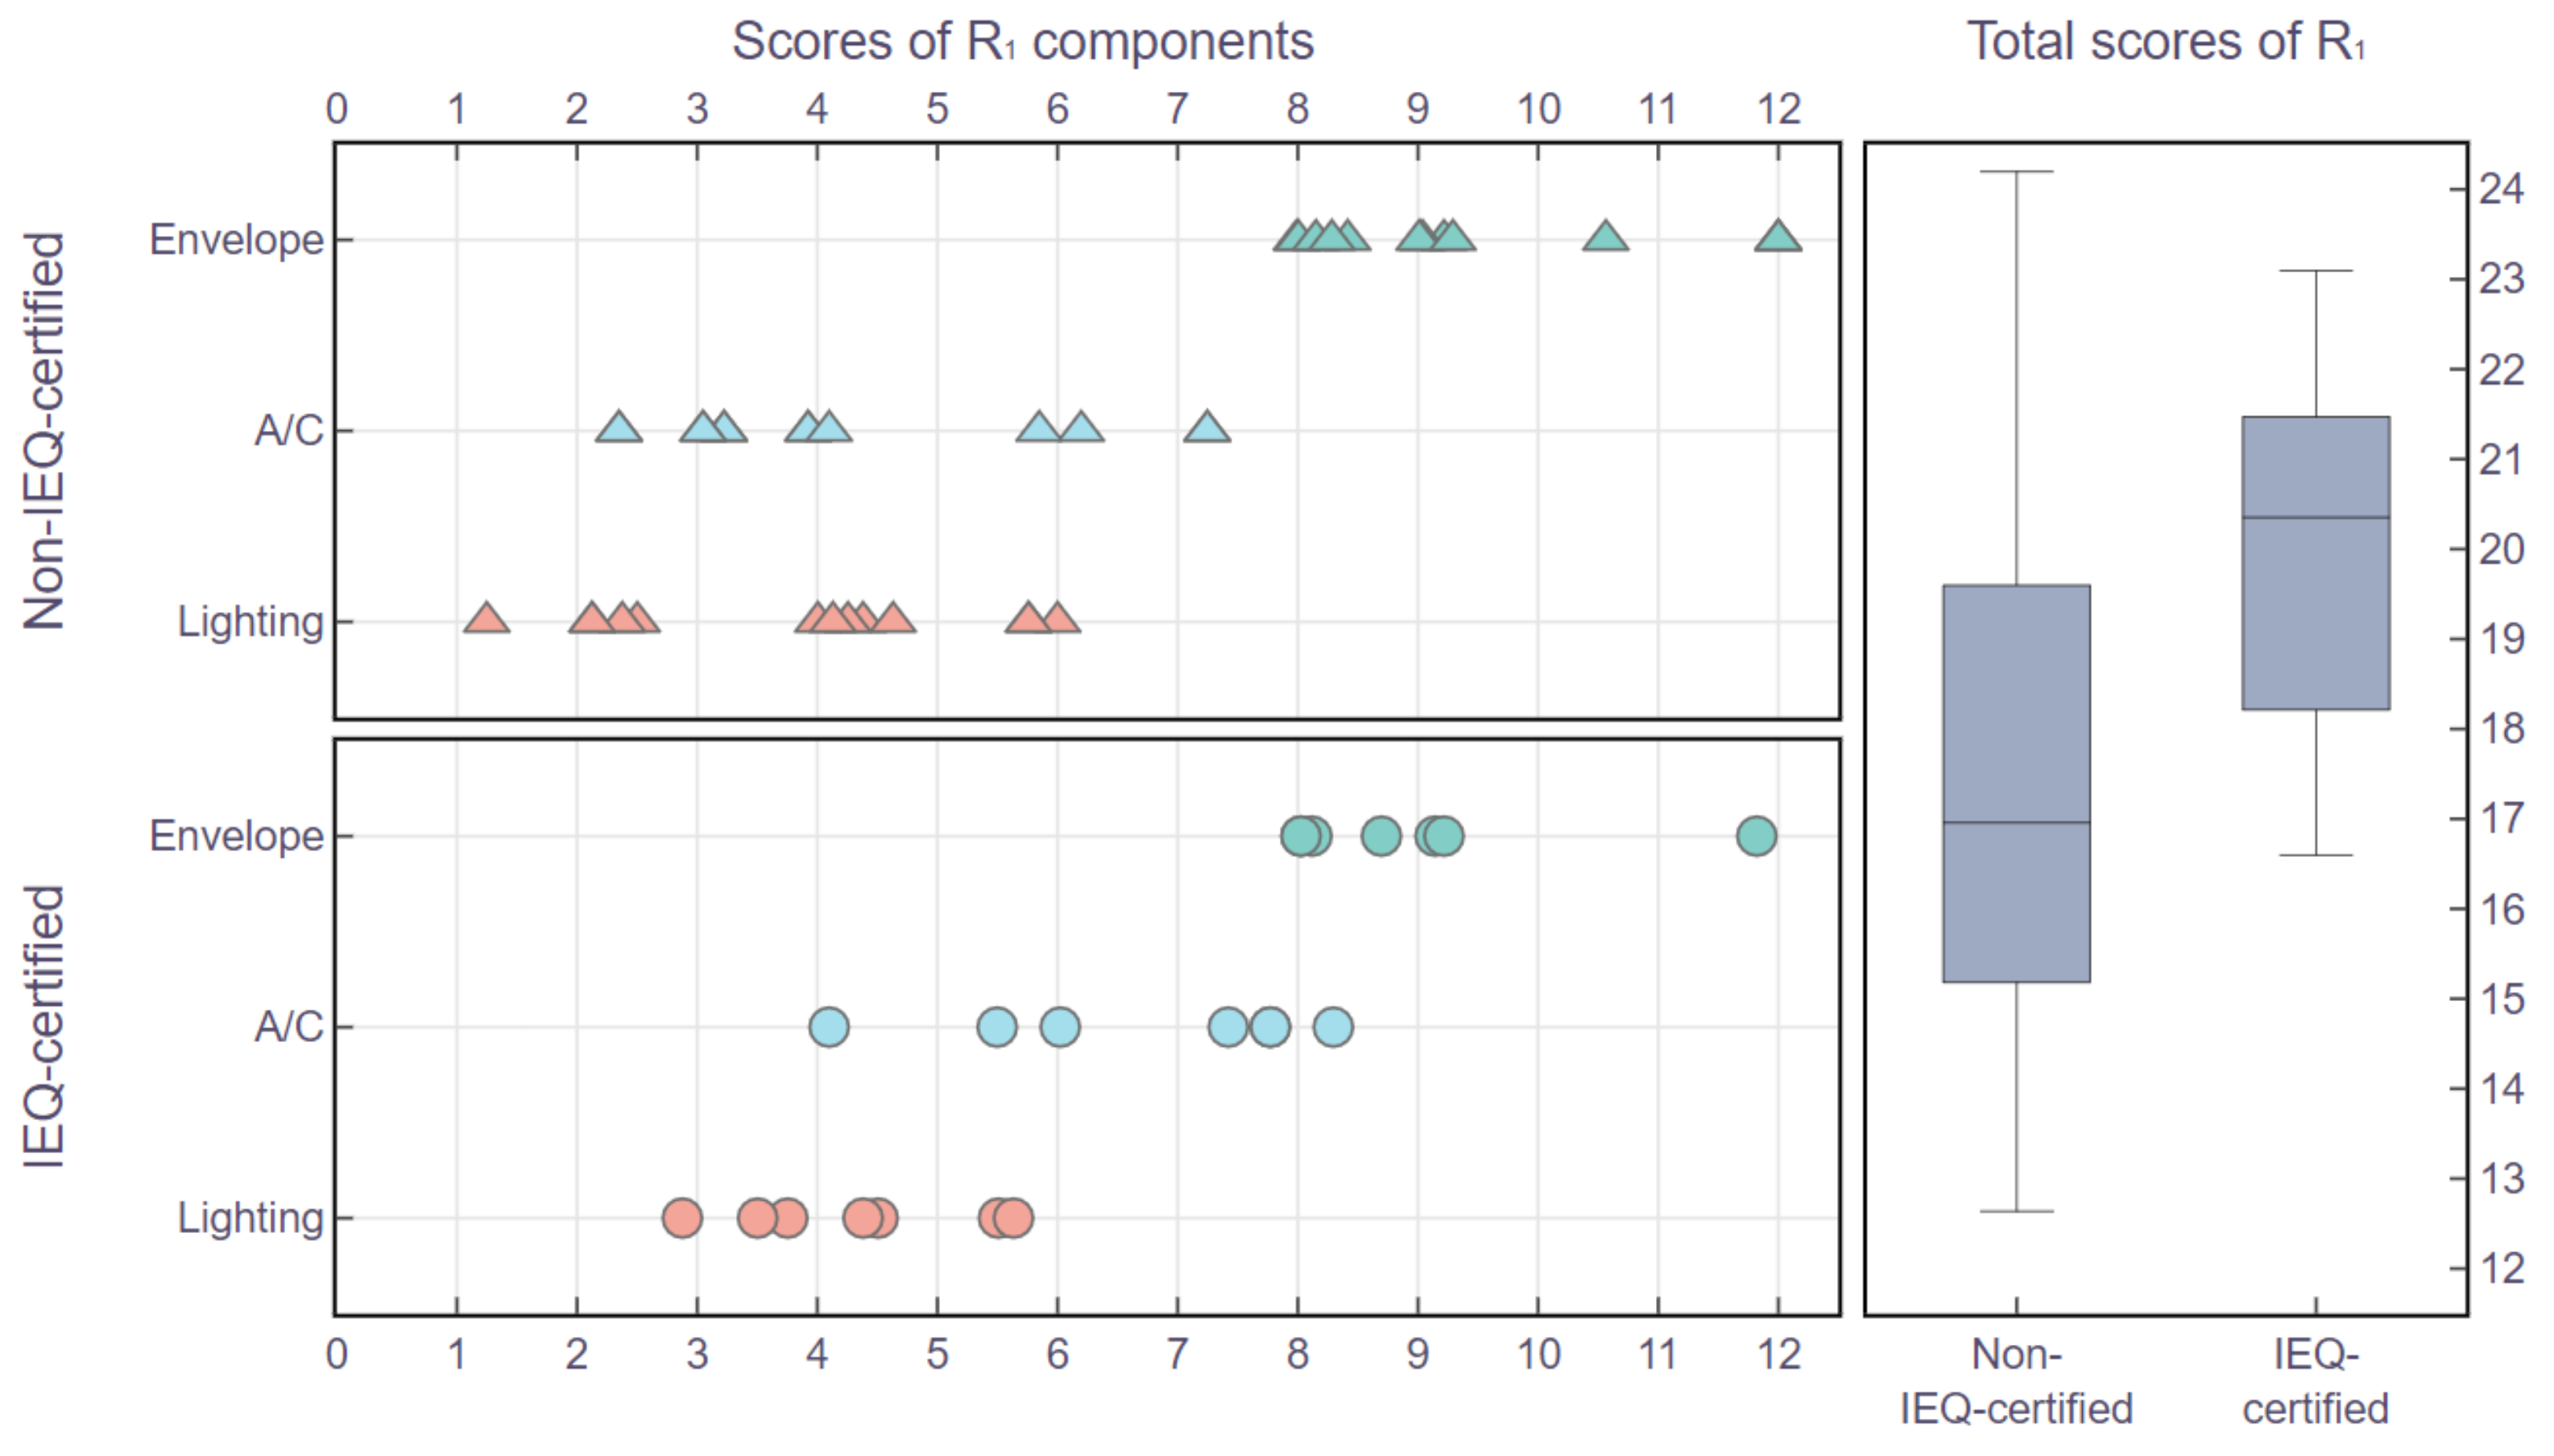
Figure 2 shows the energy-savings scores of the investigated cases as presented with and without certification of the IEQ category. For R11, all cases score above 8 points and are concentrated within 8–10 points. The scores of IEQ-certified cases are 8.0–11.8 while those of the non-IEQ-certified cases are 8.0–12.0, showing no significant differences. For R12, the IEQ-certified cases perform better that the rating scores at 4.0–8.3; for the non-IEQ-certified cases, the lowest score is 2.3 and the highest score is only 7.2. For R13, the highest scores of IEQ-certified and non-IEQ-certified cases are 5.6 and 6.0, respectively. Both are fairly close or exactly at the upper limit of 6 points. For IEQ-certified cases, the lowest score is 2.9, whereas the lowest score of non-IEQ-certified cases is only 1.2. For the overall scores of R1, IEQ-certified cases score 16.6–23.1, with a mean of 20 and median of 20.4. On the contrary, non-IEQ-certified cases score 12.6–24.2, with a mean of 17.6 and median of 16.9. It is worth noting that the highest total R1 score among all cases (23.2) is a non-IEQ-certified case, although the IEQ-certified cases have higher mean values and medians of the R1 scores. At the same time, the CE of all cases is NT$ 218–698 per unit of floor area, as shown in Figure 3. However, there is no significant correlation between the performances of the CE and R1 scores in the overall investigated cases.
3.2. IEQ Acceptability and R1 Scores in EEWH Buildings
Through building simulations, the annual IEQ performance of each case can be comprehended and the sub-items and overall score of IEQ estimated. Figure 4 presents the annual average values of the thermal comfort, IAQ, and lighting aspects of all building cases. For the buildings with IEQ certification, the acceptability ranges of the thermal comfort, IAQ, and lighting aspects are 86.7–94.6%, 82.8–95.0%, and 91.6–95.4%, respectively. In contrast, those of the non-IEQ-certified buildings are 83.4–93.8%, 76.3–92.4%, and 83.6–98.0%.
Regarding the thermal comfort aspect, IEQ-certified buildings have a 25th quantile, median, and 75th quantile of 89.5%, 90.6%, and 91.9%, whereas the values of the non-IEQ-certified group are 87.5%, 91.7%, and 92.7%. The median and 75th quantile of the non-IEQ-certified buildings are slightly higher than those of IEQ-certified buildings. Besides, the median score of IEQ-certified buildings is lower than non-IEQ-certified buildings by 1.1%.
Regarding the IAQ aspect, the 25th quantile, median, and 75th quantile are 86.7%, 89.8%, and 91.5% in the IEQ-certified group and 85.6%, 87.9%, and 90.8% in the other group. The highest, 75th quantile, median, 25th quantile, and the lowest scores of IEQ-certified buildings all preceed those of non-IEQ-certified buildings. The difference between their median scores is 1.9%.
Concerning the illuminance aspect, the 25th quantile, median, and 75th quantile are 92.2%, 93.3%, and 95.1% in IEQ buildings and 89.5%, 94.1%, and 95.6% in non-IEQ buildings. The non-IEQ-certified buildings surpass IEQ-certified buildings for the highest score by 2.6%, but the lowest score of non-IEQ-certified buildings is 8% behind that of the other group. In addition, the median score of non-IEQ-certified buildings is higher than that of IEQ-certified buildings by 0.8%.
Moreover, Figure 5 shows the annual average IEQaccept of all cases. The IEQ-certified buildings are represented by a green bar, and the non-IEQ-certified buildings are represented by a red bar. Overall, there are 10 buildings with an IEQaccept score higher than 90%; four of these buildings are IEQ-certified and six of them are non-IEQ-certified. However, the average score of IEQ-certified buildings (90.5%) is only 1.2% higher than that of non-IEQ-certified buildings (89.3%).
3.3. CE and CIEQ
Some characteristics of building designs, such as geographic locations, climatic conditions, building scales, shape factors, and space configurations, as well as HVAC systems of different scales and types (air-handling unit, fan-coil unit, or variable refrigerant flow), have not yet been incorporated into the energy-savings category in the EEWH; however, these characteristics, which all affect the CE and CIEQ of a building, are difficult to compare with each other on certain scales.
This study applied the cost ratio of CIEQ to CE to illustrate the influence of IEQ certification on daily energy expenses. As shown in Figure 6, the cost ratios of most cases are less than 0.6. The cost ratios of IEQ-certified buildings are concentrated between 0.3 and 0.6 and the average ratio is about 0.35. In comparison, the cost ratios of non-IEQ-certified buildings are from 0 to 9.5 whereas the average is around 1.4. Meanwhile, three non-IEQ-certified buildings have extremely high cost ratios. The case E-2 has the highest cost ratio, which is 9.5. The other two buildings are case C-4 (ratio = 3.94) and case T-5 (ratio = 3.33). The average of the IEQ-certified buildings is lower than that of the non-IEQ-certified buildings by 1.18.
Besides, for all investigated cases, when the IEQaccept of a building is poorer, the additional personnel cost increases, leading to higher CIEQ. As the IEQaccept of an investigated case is lower than 87% (such as the poorest three cases), the annual CIEQ exceeds NT$1300/m2; when the IEQaccept value is as low as 83% (E-2), CIEQ increases to approximately NT$3000/m2. Simultaneously, in the other investigated cases with an IEQaccept value over 87%, the average of their CIEQ is only NT$83.6/m2.
4. Discussion
According to the simulation results, it is known that IEQ certification indeed has an influence on the building performance and total building energy expenses. Therefore, this study will discuss the differences between the energy-savings category (R1 scores), IEQ category (R2 scores), and cost ratios (CE and CIEQ) between two groups of buildings in this section.
4.1. Insight of Energy-Savings Rating Scores and Energy Costs in EEWH Buildings
The energy consumption of HVAC and lighting systems are included in the energy costs discussed in this study. The energy cost of an EEWH building concerns not only the building design (R1 score) but also the performance (R2 score).
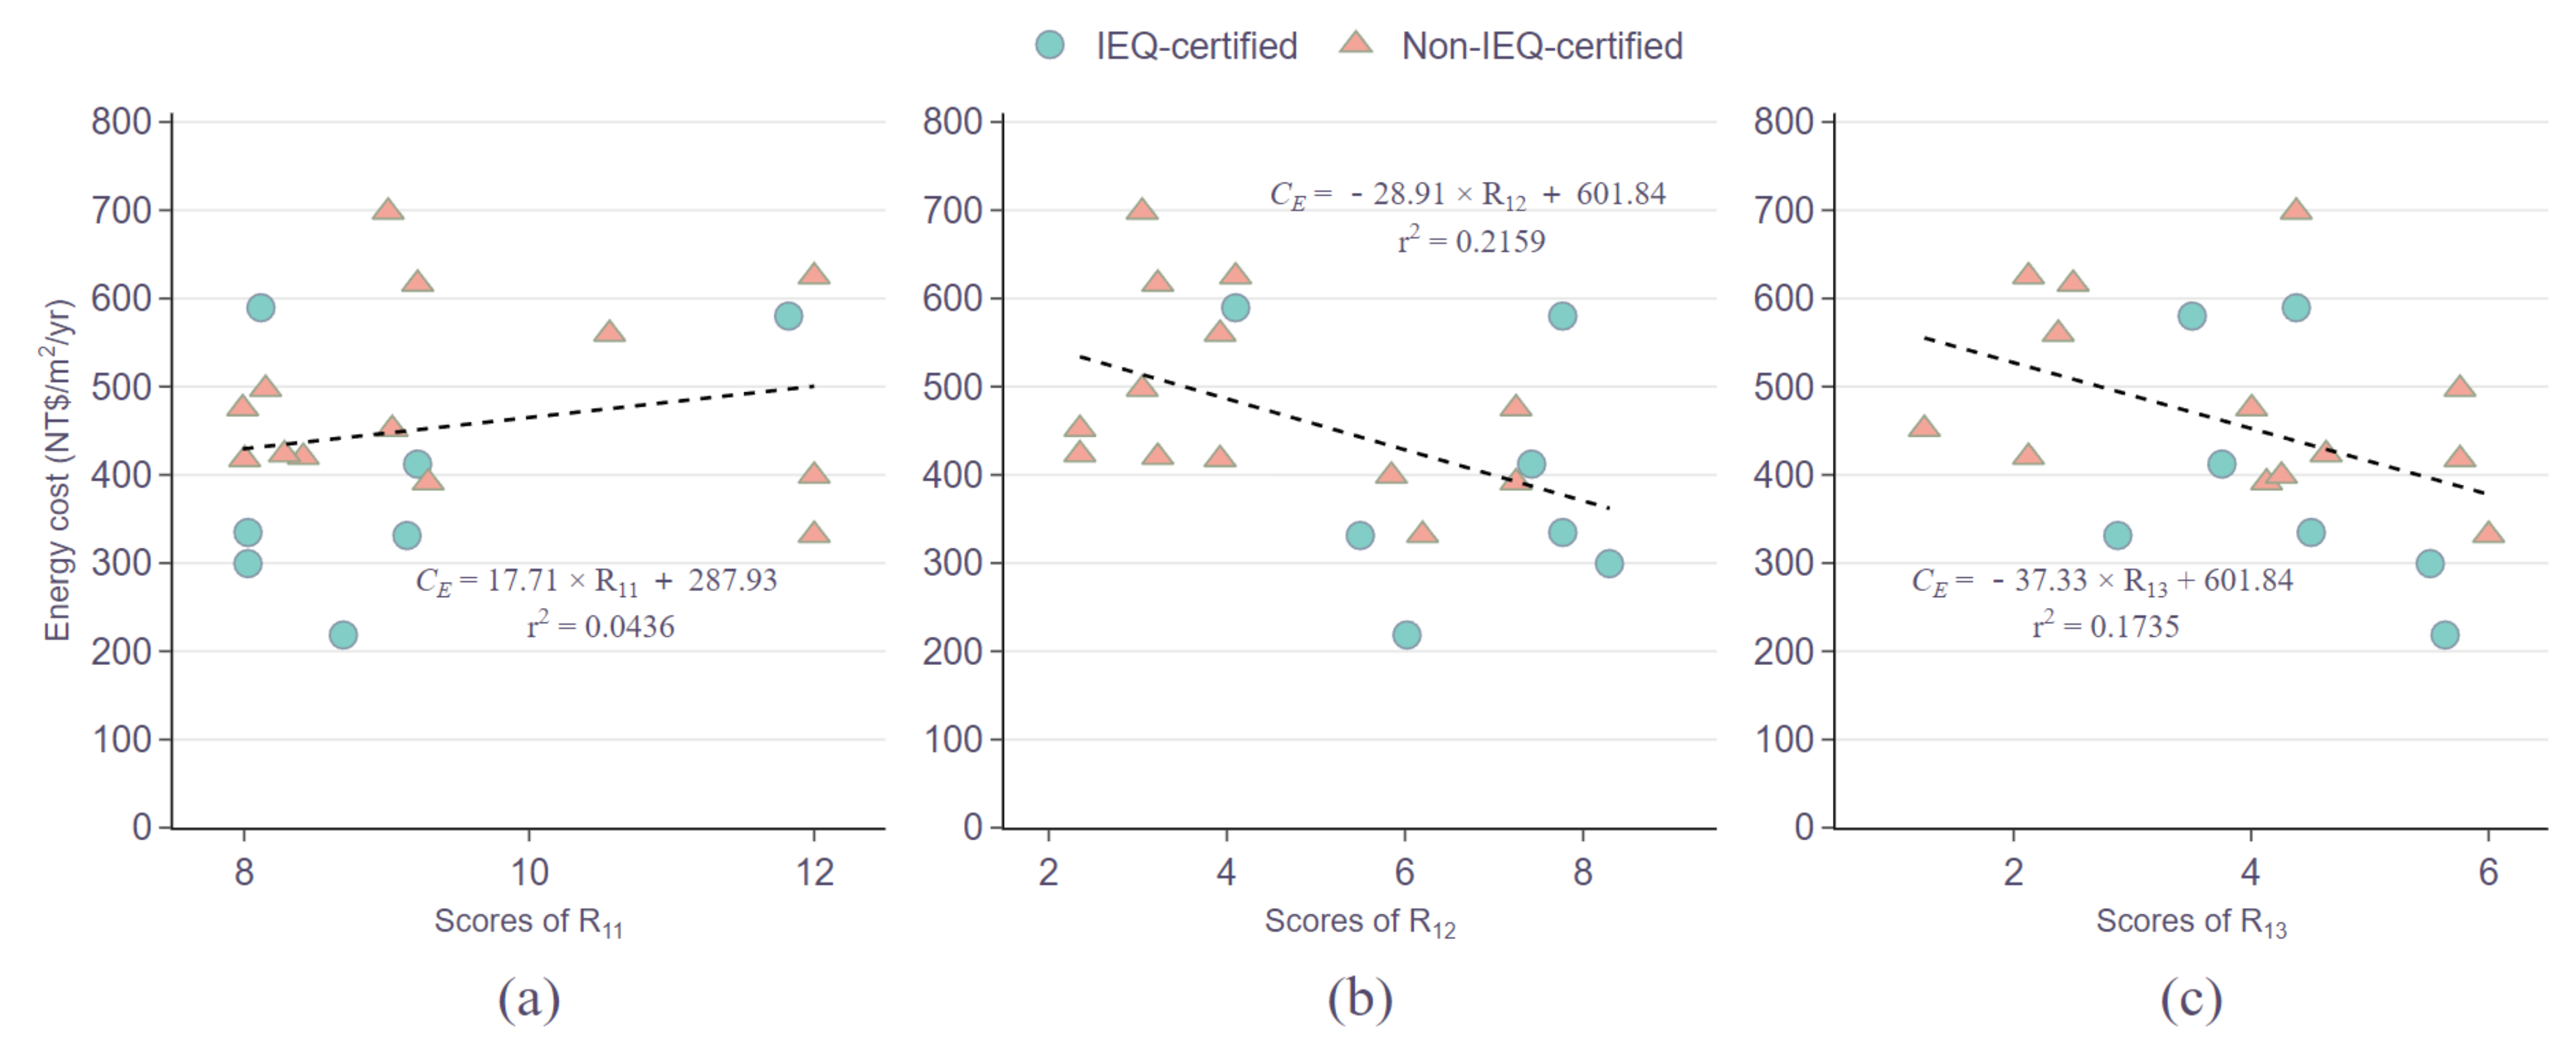
The relationships between energy costs and the aspects of R1 scores are shown in Figure 7. The R11 scores of IEQ-certified buildings (at average 9.0 score) and non-IEQ-certified buildings (at average 9.5 score) are both in the relatively high level of the R11 rating (score range 0–12). As shown in Figure 7a, the relationship between R11 scores and energy costs is not significant. The R12 scores of IEQ-certified buildings (at average 6.7 score) perform better than those of non-IEQ-certified buildings (at average 4.3 score), but the R12 scores of both groups are in the low level of the R12 rating (score range 0–14). In Figure 7b, the relationship between R12 scores and energy costs is negative, though the r2 value is only 0.2159. The R13 scores of the studied cases are distributed within the R13 rating (score range 0–6). The average score of IEQ-certified buildings is 4.3 and that of non-IEQ-certified buildings is 3.8. Referring to Figure 7c, the energy costs show negative relations with the scattered R13 scores. Although the r2 values between the energy costs and the R1 rating aspects are not significant, it still implies that a higher R12 or R13 score may help to reduce the energy costs. The results showing that it is difficult for GBC rating scores to reflect the energy performance match the findings in previous studies [22,61].
4.2. Insight of IEQ Rating Scores and IEQ Acceptability in EEWH Buildings
The relationships between energy costs, IEQ performance, and the aspects of R2 scores are difficult to verify because it is not mandatory for every EEWH building to pass the IEQ certification. Thus, this study can only discuss the impact of the IEQ category in EEWH on the IEQ performance and acceptance (IEQaccept) of the investigated cases.
First of all, the IEQ category in EEWH actually influences the outcomes of building simulations. Since the IEQ category in EEWH does not include the aspect of thermal comfort, the setpoint of the indoor temperature is fixed as 24 °C throughout the building simulations, which is the thermal neutral temperature from local research [62]. Besides, there is no significant difference regarding the thermal comfort acceptability between IEQ and non-IEQ buildings owing to the preconditions of the HVAC control (Figure 4). The major distinctions of the thermal comfort performance are caused by the solar heat gains of each case. The acquired solar radiation makes the indoor mean radiant temperature (MRT) vary with the envelope designs of the investigated cases, resulting in not only an increase of the cooling load but also the perceived thermal discomfort. A previous study [63] also explained the influence of building envelope energy-saving regulations on the cooling load and indoor thermal comfort.
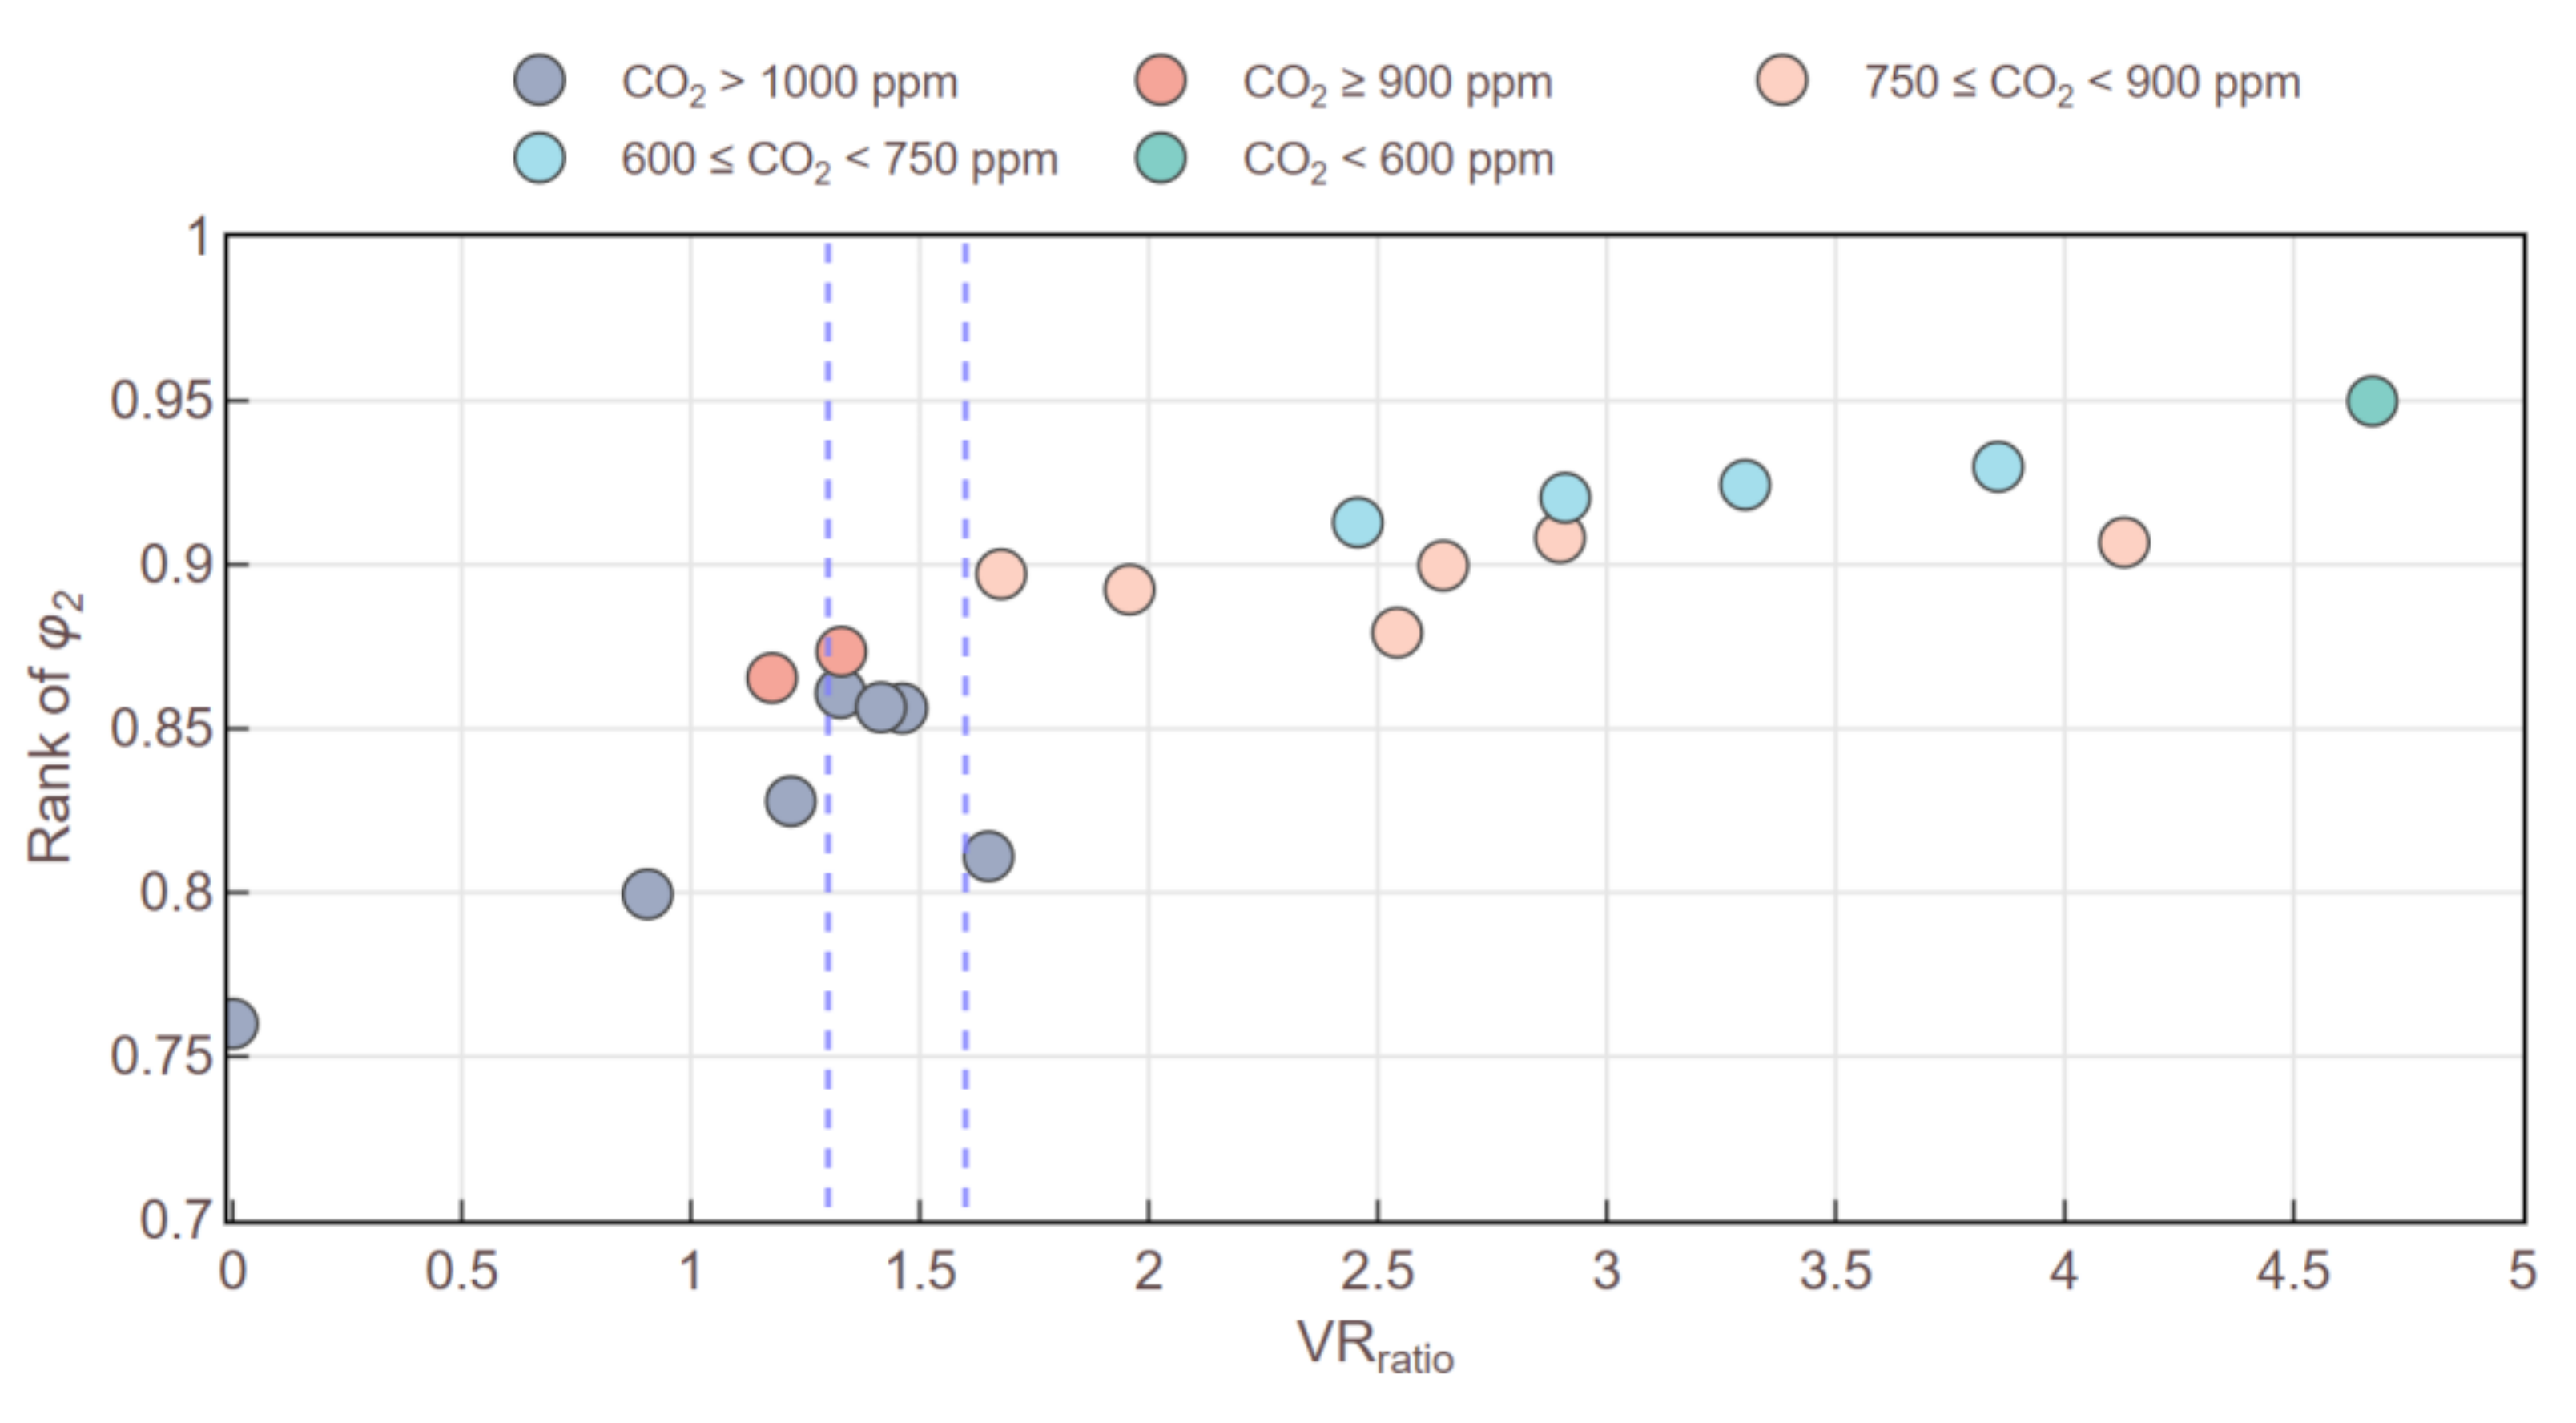
Secondly, the outdoor air ventilation rate plays an important role in maintaining sufficient IAQ and occupant satisfaction by introducing fresh air into buildings. Besides, the increasing cooling energy expense corresponding with a high ventilation rate is a consideration in hot-humid Taiwan. However, neither the related aspects for evaluating the ventilation rate nor the regulations for monitoring indicators of air pollutants, such as the CO2 concentration [64], are included in the EEWH certification system. Instead, there are only credit points in five ranks over the floor area proportion of ventilated spaces. The ventilation rate criteria in EEWH only provides suggestions for adopting real-time CO2 monitoring for energy efficiency that may reward credits in the energy-savings category; however, the criteria do not reflect the occupants’ satisfaction related to IAQ. The median of the IAQ acceptability in IEQ-certified buildings (at the value of 89.8) is higher than that of non-IEQ-certified buildings (at the value of 87.9) by 1.9% (Figure 4). Moreover, this study compared the ventilation rate of the studied cases to the minimum ventilation rate in ASHRAE 62.1 [65]. The comparison values werre calculated as VRratio by dividing the ventilation rates of the studied cases with the threshold of ASHRAE 62.1. Figure 8 displays the relationship between the IAQ acceptance (φ2), annual maximum CO2 level, and the values of VRratio. The scatters show that six of these cases fail to meet the Taiwanese standard of Indoor Air Quality Act (2011) [66], which is a provision for office spaces with all-time CO2 < 1000 ppm. According to the results, the buildings with VRratio lower than 1.6 may easily have a high CO2 concentration, and buildings with VRratio even lower than 1.3 tend to further decrease the IAQ acceptance. The results reveal the lack of prevention mechanisms and regulations in the EEWH system mentioned above.
Thirdly, compared with the thermal comfort and IAQ aspects, the criteria of indoor illuminance in the EEWH system are relatively comprehensive. In addition, there is a national illuminance standard, CNS 12112 [67], in Taiwan. The standard states that the illuminance of all occupied indoor workplaces should meet the range of 300–750 lux. Thus, this study analyzed the relationship between the range of annual indoor illuminance during working hours (8 a.m. to 6 p.m.) and the rating scores of R13 of each investigated case. According to the results shown in Figure 9, artificial lighting designs for all investigated cases are above the average of 300 lux. Coupled with daylighting as an aid, the lowest indoor illuminance of each case meets the recommendations of CNS 12112. At the same time, apart from the C-2 case, regardless of whether a case is IEQ-certified or not, the median of the indoor illuminance is above 500 lux, and the lighting acceptance (φ4) can also reach 90%. It is worth noting that the E-2 case, the lowest artificial lighting design (311 lux), can make its indoor illuminance surpass 600 lux for more than 70% of working hours with the assistance of daylight utilization.
Furthermore, when observing the scores of R13 and artificial lighting designs, it was found that cases with similar R13 scores may not necessarily have consistent design values. For example, in the C-2, S-1, P-4, T-1, and T-4 cases, owing to the use of poor-efficiency lighting equipment, their R13 scores are all below 2.5 points though their artificial lighting designs vary from 440 to 600 lux. In contrast, T-2, S-2, and C-4 use LED lighting equipment with a better luminous efficiency, and their R13 scores are higher than 5.0. However, it was also discovered that E-2 deliberately reduces the artificial lighting design to have a high R13 score with the compromise of visual comfort. In addition, although the C-3 case uses LED lighting equipment, the excessive lighting design and energy inefficiency decrease the R13 score. To avoid similar situations, such as cases E-2 or C-3, this study suggests adjusting the benchmarks in the EEWH system against excessive or insufficient lighting.
Generally, the larger the value of WWR, the more abundant daylight can be introduced into a building. The use of natural daylight can reduce lighting energy consumption and provide sufficient illuminance in the office. By comparing the artificial lighting design and the range of indoor illuminance, it can be observed that natural lighting may assist in providing adequate illuminance during working hours in the cases of E-2, P-2, S-2, P-5, T-5, P-1, T-4, and E-4. Furthermore, if artificial lighting can be operated with proper strategies in the investigated cases, most of the cases will achieve extra lighting energy-saving benefits. However, no EEWH-certified building has applied for the daylight-sensing control bonus in R13 so far due to the difficulty of daylight control. Despite daylight providing a more pleasant indoor environment than artificial lighting, it is possible that workspaces in perimeter zones may directly receive uncomfortable glare if there is no shading device. Thus, it is necessary to install internal venetian blinds for these areas to reduce the impact from glare and provide a working environment without daylight discomfort glare [68,69].
4.3. Cost Ratio and Energy-Savings and IEQ Categories in EEWH Buildings
Section 3.3 shows that the additional costs derived from IEQ performance account for lower proportions of the total costs in IEQ-certified buildings than in non-IEQ-certified buildings (Figure 6). Meanwhile, three non-IEQ-certified buildings have extremely high cost ratios. Among the worst three cases, case E-2 has its CIEQ approximately 9.5 times to its CE due to the insufficient designs in the thermal comfort, outdoor air supply, and illuminance. The cost ratios of the other two cases are around 3.33–3.94 due to the insufficient ventilation rate and illuminance level.
According to the results of this study, the IEQ certification in EEWH does not have an obvious influence on the IEQ performance (Figure 5) and total cost ratios (Figure 6). Additionally, for the buildings with higher IEQ and energy performance, the number of non-IEQ-certified buildings is more than that of IEQ-certified buildings. There are six non-IEQ-certified and four IEQ-certified buildings for which the IEQaccept is higher than 90%. The performance of the cost ratio provided a consistent result. There are 10 non-IEQ-certified and 7 IEQ-certified buildings that have a cost ratio lower than 1.
However, for buildings with a relatively poor performance (IEQaccept < 90%), especially the non-IEQ-certified cases, there is a higher possibility of obtaining an abnormal cost ratio, which is not supposed to occur in GBs. The results of this study correspond to previous research showing that the certified GBs have a wide range of building performances, but the worst ones may not be different from CBs [70]. Besides, all of the studies with similar results concluded that this phenomenon should be amended through GBCs amendment to make the scoring schemes of GBCs focus on the categories that actually improve occupants’ health, well-being, and productivity [35,37,40,43].
Generally, the EEWH certification system certainly influences the performance of GBs in Taiwan, and its contribution to energy conservation is quite significant. Even though there are no linear relationships between the scores of energy conservation (R1) and building energy cost (CE), the energy performance of EEWH buildings in this study is approximately 20–75% of the average value in Taiwan buildings. In comparison, as the IEQ category is only an optional item in EEWH, it not only decreases the contribution of the EEWH system to improving IEQ in GBs, but also leads to some architecture designers ignoring the essentials of human well-being in buildings. The inconsistent IEQ performance of EEWH buildings makes the contribution of EEWH to IEQ more ambiguous and tenuous. Meanwhile, the non-IEQ-certified cases may easily result in a relatively poor indoor environment and huge additional burden owing to the thermal comfort, IAQ, and illuminance of these cases being sub-standard.
4.4. Suggestions for Taiwan’s GBC
On the basis of the results and discussions above, this study suggested that the EEWH certification system in Taiwan can be improved by the following recommendations:
- Add the IEQ category as one of the mandatory items in EEWH;
- Establish the thermal comfort criteria in the inspections of the IEQ category to ensure the thermal comfort control standard in EEWH green buildings;
- Identify the ventilation criteria in the inspections of the IEQ category and employ professional standards, such as ASHRAE 62.1 or Indoor Air Quality Act, to improve the IAQ, ventilation rate, and energy efficiency in EEWH green buildings;
- Specify the indoor illuminance criteria in the inspections of the IEQ category and adopt the upper and lower limits specified by CNS 12112 to prevent excessive or insufficient lighting;
- According to the existing R1 and R2 rating schemes, the supplement items should identify the limits to prevent excessive or inappropriate designs.
The complements for IEQ and energy-savings categories may advance the EEWH system to balance human thermal comfort and energy efficiency, and then promote the notion of sustainable buildings in Taiwan.
5. Conclusions
This study examined 20 EEWH-certified green offices and their rating scores in the energy-savings and IEQ categories. The annual energy consumption and the extra costs derived from the IEQ performances of the investigated cases were estimated by building simulations. Through the simulation results, the energy performances of the study cases were found to all be regular and even better than the baseline in Taiwan because the energy conservation category is one of the mandatory inspections in the EEWH system.
However, in terms of the IEQ aspect, some cases appeared to have problems with omissions or inappropriateness in IEQ designs due to the voluntary-based IEQ category and its incomprehensive scoring system. In terms of the building energy aspect, the average cost ratio (CIEQ/CE) of the seven IEQ-certified cases was 0.35, which is obviously lower than the average of 1.4 for 13 non-IEQ-certified cases. Among the non-IEQ-certified cases, most of the cost ratio values were relatively low, but there were three cases whose CIEQ was much higher than CE. In one of the high cost ratio cases, the insufficient designs for all the aspects of thermal comfort, ventilation, and lighting resulted in the CIEQ being 9.5 times the CE; the insufficient ventilation and lighting designs in the other two cases led to the CIEQ being 3.33–3.94 times the corresponding CE.
Through the analysis of CE and CIEQ, as well as referring to the discussions related to IEQ aspects including the thermal, ventilation, and lighting environment, this study inspected the advantages and disadvantages of the EEWH certification system. The results of this paper match some previous findings that green buildings certified by GBCs do not necessarily guarantee better IEQ satisfaction and energy performance. In addition, this study further proposed recommendations for strengthening the EEWH certification system in the energy-savings and IEQ categories. The recommendations are essential requirements related to indoor human comfort, health, and well-being. Based on the recommendations, green buildings in Taiwan are expected to mitigate the design and performance anomalies and improve the building environment in the future. Ultimately, this study anticipates provoking much more relevant research on the same topic for improving GBCs and creating a sustainable, comfortable, and energy-efficient building environment.
Author Contributions
Conceptualization, R.-L.H. and Y.-T.W.; methodology, R.-L.H. and Y.-T.W.; formal analysis, R.-L.H. and Y.-T.W.; investigation, R.-L.H. and Y.-T.W.; resources, R.-L.H.; data curation, R.-L.H.; writing—original draft preparation, R.-L.H. and Y.-T.W.; writing—review and editing, W.-A.C.; visualization, R.-L.H. and Y.-T.W.; supervision, R.-L.H.; project administration, R.-L.H. All authors have read and agreed to the published version of the manuscript.
Funding
This research received no external funding.
Institutional Review Board Statement
Not applicable.
Informed Consent Statement
Not applicable.
Data Availability Statement
The data presented in this study is available on request from the corresponding author.
Conflicts of Interest
The authors declare no conflict of interest.
References
- Klepeis, N.E.; Nelson, W.C.; Ott, W.R.; Robinson, J.P.; Tsang, A.M.; Switzer, P.; Behar, O.V.; Hern, S.C.; Engelmann, W.H. The National Human Activity Pattern Survey (NHAPS): A resource for assessing exposure to environmental pollutants. J. Expo Sci. Environ. Epidemiol. 2001, 11, 231–252. [Google Scholar] [CrossRef] [PubMed] [Green Version]
- International Energy Agency and the United Nations Environment Programme. 2018 Global Status Report: Towards a Zero-Emission, Efficient and Resilient Buildings and Construction Sector; International Energy Agency and the United Nations Environment Programme: Paris, France, 2018. [Google Scholar]
- Anand, P.; Cheong, D.; Sekhar, C. A review of occupancy-based building energy and IEQ controls and its future post-COVID. Sci. Total Environ. 2021, 804, 150249. [Google Scholar] [CrossRef] [PubMed]
- Clements-Croome, D. Creative and productive workplaces: A review. Intell. Build. Int. 2015, 7, 164–183. [Google Scholar] [CrossRef]
- Buildings and Their Impact on the Environment: A Statistical Summary; Compiled by U.S. Environmental Protection Agency Green Building Workgroup; United States Environmental Protection Agency (US EPA): Washington, DC, USA, 2017.
- Laustsen, J. Energy Efficiency Requirements in Building Codes, Energy Efficiency Policies for New Buildings; International Energy Agency (IEA): Paris, France, 2008; Volume 85, p. 73. [Google Scholar]
- Darko, A.; Chan, A.P.C. Review of Barriers to Green Building Adoption. Sustain. Dev. 2016, 25, 167–179. [Google Scholar] [CrossRef]
- Darko, A.; Chan, A.P. Critical analysis of green building research trend in construction journals. Habitat Int. 2016, 57, 53–63. [Google Scholar] [CrossRef]
- Zuo, J.; Zhao, Z.-Y. Green building research–current status and future agenda: A review. Renew. Sustain. Energy Rev. 2014, 30, 271–281. [Google Scholar] [CrossRef]
- Zhang, Y.; Wang, H.; Gao, W.; Wang, F.; Zhou, N.; Kammen, D.M.; Ying, X. A Survey of the Status and Challenges of Green Building Development in Various Countries. Sustainability 2019, 11, 5385. [Google Scholar] [CrossRef] [Green Version]
- Kim, J.; de Dear, R. Workspace satisfaction: The privacy-communication trade-off in open-plan offices. J. Environ. Psychol. 2013, 36, 18–26. [Google Scholar] [CrossRef] [Green Version]
- Oral, G.K.; Yener, A.K.; Bayazit, N.T. Building envelope design with the objective to ensure thermal, visual and acoustic comfort conditions. Build. Environ. 2004, 39, 281–287. [Google Scholar] [CrossRef]
- Yun, G.Y.; Kim, H.; Kim, J.T. Effects of occupancy and lighting use patterns on lighting energy consumption. Energy Build. 2012, 46, 152–158. [Google Scholar] [CrossRef]
- Yun, G.Y.; Kong, H.J.; Kim, H.; Kim, J.T. A field survey of visual comfort and lighting energy consumption in open plan offices. Energy Build. 2012, 46, 146–151. [Google Scholar] [CrossRef]
- Muller, C.; Yu, H. Using Enhanced Air Cleaning to Integrate IAQ and Energy Conservation. Procedia Eng. 2017, 205, 3042–3049. [Google Scholar] [CrossRef]
- Steinemann, A.; Wargocki, P.; Rismanchi, B. Ten questions concerning green buildings and indoor air quality. Build. Environ. 2017, 112, 351–358. [Google Scholar] [CrossRef] [Green Version]
- Geng, Y.; Ji, W.; Lin, B.; Zhu, Y. The impact of thermal environment on occupant IEQ perception and productivity. Build. Environ. 2017, 121, 158–167. [Google Scholar] [CrossRef]
- Lan, L.; Wargocki, P.; Lian, Z. Quantitative measurement of productivity loss due to thermal discomfort. Energy Build. 2011, 43, 1057–1062. [Google Scholar] [CrossRef]
- Asensio, O.I.; Delmas, M.A. The effectiveness of US energy efficiency building labels. Nat. Energy 2017, 2, 8. [Google Scholar] [CrossRef]
- Wu, X.; Peng, B.; Lin, B. A dynamic life cycle carbon emission assessment on green and non-green buildings in China. Energy Build. 2017, 149, 272–281. [Google Scholar] [CrossRef]
- Collinge, W.; Landis, A.E.; Jones, A.K.; Schaefer, L.A.; Bilec, M.M. Indoor environmental quality in a dynamic life cycle assessment framework for whole buildings: Focus on human health chemical impacts. Build. Environ. 2013, 62, 182–190. [Google Scholar] [CrossRef]
- Newsham, G.R.; Birt, B.J.; Arsenault, C.; Thompson, A.J.; Veitch, J.A.; Mancini, S.; Galasiu, A.D.; Gover, B.N.; Macdonald, I.A.; Burns, G.J. Do ‘green’ buildings have better indoor environments? New evidence. Build. Res. Inf. 2013, 41, 415–434. [Google Scholar] [CrossRef]
- International Standard ISO 17772-1:2017; Energy Performance of Buildings—Indoor Environmental Quality—Part 1: Indoor Environmental Input Parameters for the Design and Assessment of Energy Performance of Buildings. International Organization for Standardization: Geneva, Switzerland, 2017; p. 60.
- European Standard EN 16798-1:2019; Energy Performance of Buildings—Ventilation for Buildings—Part 1: Indoor Environmental Input Parameters for Design and Assessment of Energy Performance of Buildings Addressing Indoor Air Quality, Thermal EnviRonment, Lighting and Acoustics—Module M1-6. European Standards s.r.o.: Pilsen, Czech Republic, 2019; p. 79.
- Prochorskaite, A.; Maliene, V. Health, Well-Being and Sustainable Housing. Int. J. Strateg. Prop. Manag. 2013, 17, 44–57. [Google Scholar] [CrossRef]
- Chen, X.; Yang, H.; Lu, L. A comprehensive review on passive design approaches in green building rating tools. Renew. Sustain. Energy Rev. 2015, 50, 1425–1436. [Google Scholar] [CrossRef]
- Mattoni, B.; Guattari, C.; Evangelisti, L.; Bisegna, F.; Gori, P.; Asdrubali, F. Critical review and methodological approach to evaluate the differences among international green building rating tools. Renew. Sustain. Energy Rev. 2018, 82, 950–960. [Google Scholar] [CrossRef]
- Pei, Z.; Lin, B.; Liu, Y.; Zhu, Y. Comparative study on the indoor environment quality of green office buildings in China with a long-term field measurement and investigation. Build. Environ. 2015, 84, 80–88. [Google Scholar] [CrossRef]
- Sediso, B.G.; Lee, M.S. Indoor environmental quality in Korean green building certification criteriacertified office buildingsoccupant satisfaction and performance. Sci. Technol. Built Environ. 2016, 22, 606–618. [Google Scholar] [CrossRef]
- MacNaughton, P.; Satish, U.; Laurent, J.G.C.; Flanigan, S.; Vallarino, J.; Coull, B.; Spengler, J.D.; Allen, J.G. The impact of working in a green certified building on cognitive function and health. Build. Environ. 2016, 114, 178–186. [Google Scholar] [CrossRef]
- Xuan, X. Study of indoor environmental quality and occupant overall comfort and productivity in LEED- and non-LEED–certified healthcare settings. Indoor Built Environ. 2016, 27, 544–560. [Google Scholar] [CrossRef]
- Lee, J.Y.; Wargocki, P.; Chan, Y.H.; Chen, L.; Tham, K.W. Indoor environmental quality, occupant satisfaction, and acute building-related health symptoms in Green Mark-certified compared with non-certified office buildings. Indoor Air 2019, 29, 112–129. [Google Scholar] [CrossRef] [Green Version]
- Lee, Y.S.; Kim, S.-K. Indoor Environmental Quality in LEED-Certified Buildings in the U.S. J. Asian Arch. Build. Eng. 2008, 7, 293–300. [Google Scholar] [CrossRef] [Green Version]
- Paul, W.; Taylor, P.A. A comparison of occupant comfort and satisfaction between a green building and a conventional building. Build. Environ. 2008, 43, 1858–1870. [Google Scholar] [CrossRef]
- Gou, Z.; Lau, S.S.-Y.; Shen, J. Indoor Environmental Satisfaction in Two LEED Offices and its Implications in Green Interior Design. Indoor Built Environ. 2011, 21, 503–514. [Google Scholar] [CrossRef]
- Gou, Z.; Lau, S.S.-Y.; Zhang, Z. A Comparison of Indoor Environmental Satisfaction Between Two Green Buildings and A Conventional Building in China. J. Green Build. 2012, 7, 89–104. [Google Scholar] [CrossRef]
- Altomonte, S.; Schiavon, S. Occupant satisfaction in LEED and non-LEED certified buildings. Build. Environ. 2013, 68, 66–76. [Google Scholar] [CrossRef]
- Liang, H.-H.; Chen, C.-P.; Hwang, R.-L.; Shih, W.-M.; Lo, S.-C.; Liao, H.-Y. Satisfaction of occupants toward indoor environment quality of certified green office buildings in Taiwan. Build. Environ. 2014, 72, 232–242. [Google Scholar] [CrossRef]
- Thatcher, A.; Milner, K. Is a green building really better for building occupants? A longitudinal evaluation. Build. Environ. 2016, 108, 194–206. [Google Scholar] [CrossRef]
- Altomonte, S.; Saadouni, S.; Kent, M.G.; Schiavon, S. Satisfaction with indoor environmental quality in BREEAM and non-BREEAM certified office buildings. Arch. Sci. Rev. 2017, 60, 343–355. [Google Scholar] [CrossRef]
- Sant’Anna, D.; Dos Santos, P.; Vianna, N.; Romero, M. Indoor environmental quality perception and users’ satisfaction of conventional and green buildings in Brazil. Sustain. Cities Soc. 2018, 43, 95–110. [Google Scholar] [CrossRef]
- Altomonte, S.; Schiavon, S.; Kent, M.G.; Brager, G. Indoor environmental quality and occupant satisfaction in green-certified buildings. Build. Res. Inf. 2017, 47, 255–274. [Google Scholar] [CrossRef] [Green Version]
- Thatcher, A.; Milner, K. Changes in productivity, psychological wellbeing and physical wellbeing from working in a ’green’ building. Work 2014, 49, 381–393. [Google Scholar] [CrossRef] [Green Version]
- Hoffman, A.J.; Henn, R. Overcoming the Social and Psychological Barriers to Green Building. Organ. Environ. 2008, 21, 390–419. [Google Scholar] [CrossRef] [Green Version]
- EEWH: Green Building Evaluation Manual; Architecture and Building Research Institute (ABRI), Ministry of the Interior: Taipei, Taiwan, 2009.
- Wu, C.-Y.; Lo, S.-F. What Makes a Greener Building? Lessons from Taiwan. J. Environ. Prot. 2018, 09, 957–972. [Google Scholar] [CrossRef] [Green Version]
- Announcement of Approved Green Buildings in Taiwan. 2020. Available online: http://gb.tabc.org.tw/modules/filelist/index.php/main/flist/15 (accessed on 15 October 2021).
- Wei, W.; Ramalho, O.; Mandin, C. Indoor air quality requirements in green building certifications. Build. Environ. 2015, 92, 10–19. [Google Scholar] [CrossRef]
- He, Y.; Kvan, T.; Liu, M.; Li, B. How green building rating systems affect designing green. Build. Environ. 2018, 133, 19–31. [Google Scholar] [CrossRef]
- Pastore, L.; Andersen, M. Building energy certification versus user satisfaction with the indoor environment: Findings from a multi-site post-occupancy evaluation (POE) in Switzerland. Build. Environ. 2019, 150, 60–74. [Google Scholar] [CrossRef]
- Agha-Hossein, M.M.; El-Jouzi, S.; Elmualim, A.A.; Ellis, J.; Williams, M. Post-occupancy studies of an office environment: Energy performance and occupants’ satisfaction. Build. Environ. 2013, 69, 121–130. [Google Scholar] [CrossRef]
- Fisk, W.J. Health and productivity gains from better indoor environments and their relationship with building energy efficiency. Annu. Rev. Energy Environ. 2000, 25, 537–566. [Google Scholar] [CrossRef] [Green Version]
- Licina, D.; Bhangar, S.; Pyke, C. Occupant Health & Well-Being in Green Buildings. Ashrae J. 2019, 61, 74–77. [Google Scholar]
- McArthur, J.; Powell, C. Health and wellness in commercial buildings: Systematic review of sustainable building rating systems and alignment with contemporary research. Build. Environ. 2020, 171, 106635. [Google Scholar] [CrossRef]
- Jin, Q.; Overend, M.; Thompson, P. Towards productivity indicators for performance-based façade design in commercial buildings. Build. Environ. 2012, 57, 271–281. [Google Scholar] [CrossRef]
- Kawamura, A.; Tanabe, S.I.; Nishihara, N.; Haneda, M.; Ueki, M. Evaluation Method for Effects of Improvement of Indoor Environmental Quality on Productivity; WellBeing Indoors: Helsinki, Finland, 2007. [Google Scholar]
- Jin, Q.; Overend, M.; Thompson, P. A whole-life value assessment and optimisation model for high-performance glazed facades. In Proceedings of the International Conference of Building Simulation, Sydney, Australia, 14–16 November 2011. [Google Scholar]
- Wong, L.T.; Mui, K.; Hui, P. A multivariate-logistic model for acceptance of indoor environmental quality (IEQ) in offices. Build. Environ. 2008, 43, 1–6. [Google Scholar] [CrossRef]
- Alwisy, A.; BuHamdan, S.; Gül, M. Evidence-based ranking of green building design factors according to leading energy modelling tools. Sustain. Cities Soc. 2019, 47, 101491. [Google Scholar] [CrossRef]
- Hong, T.; Chang, W.-K.; Lin, H.-W. A fresh look at weather impact on peak electricity demand and energy use of buildings using 30-year actual weather data. Appl. Energy 2013, 111, 333–350. [Google Scholar] [CrossRef] [Green Version]
- Geng, Y.; Ji, W.; Wang, Z.; Lin, B.; Zhu, Y. A review of operating performance in green buildings: Energy use, indoor environmental quality and occupant satisfaction. Energy Build. 2018, 183, 500–514. [Google Scholar] [CrossRef]
- Chen, C.-P.; Hwang, R.-L.; Chang, S.-Y.; Lu, Y.-T. Effects of temperature steps on human skin physiology and thermal sensation response. Build. Environ. 2011, 46, 2387–2397. [Google Scholar] [CrossRef]
- Hwang, R.-L.; Shu, S.-Y. Building envelope regulations on thermal comfort in glass facade buildings and energy-saving potential for PMV-based comfort control. Build. Environ. 2011, 46, 824–834. [Google Scholar] [CrossRef]
- Salis, L.C.R.; Abadie, M.; Wargocki, P.; Rode, C. Towards the definition of indicators for assessment of indoor air quality and energy performance in low-energy residential buildings. Energy Build. 2017, 152, 492–502. [Google Scholar] [CrossRef]
- ANSI/ASHRAE Standard 62.1-2019; Ventilation for Acceptable Indoor Air Quality. American Society of Heating, Refrigerating and Air-Conditioning Engineers (ASHRAE): Atlanta, GA, USA, 2019.
- Indoor Air Quality Act 2011, Environmental Protection Administration: Taiwan. Available online: https://law.moj.gov.tw/ENG/LawClass/LawAll.aspx?pcode=O0130001 (accessed on 5 November 2021).
- CNS 12112; Lighting of Indoor Work Places. Chinese National Standards: Taiwan, 2012. Available online: http://www.gbstandards.org/CNS/CNS_standard.asp?word=CNS%2012112 (accessed on 5 November 2021).
- Fasi, M.A.; Budaiwi, I.M. Energy performance of windows in office buildings considering daylight integration and visual comfort in hot climates. Energy Build. 2015, 108, 307–316. [Google Scholar] [CrossRef]
- Kwong, Q.J. Light level, visual comfort and lighting energy savings potential in a green-certified high-rise building. J. Build. Eng. 2020, 29, 101198. [Google Scholar] [CrossRef]
- Leaman, A.; Bordass, B. Are users more tolerant of ‘green’ buildings? Build. Res. Inf. 2007, 35, 662–673. [Google Scholar] [CrossRef]
Figure 1.
The flowchart of this study used for investigating IEQ and energy costs in green buildings.
Figure 1.
The flowchart of this study used for investigating IEQ and energy costs in green buildings.

Figure 2.
Scores of the total and three aspects of the energy conservation category. Green represents Envelope, blue represents A/C, orange represents Lighting. And the triangle represents non-IEQ-certified, the circular represents IEQ-certified.
Figure 2.
Scores of the total and three aspects of the energy conservation category. Green represents Envelope, blue represents A/C, orange represents Lighting. And the triangle represents non-IEQ-certified, the circular represents IEQ-certified.

Figure 3.
R1 scores and CE performances of the investigated cases.

Figure 4.
Acceptance of IEQ components. Orange represents non-IEQ-certified, green represents IEQ-certified.
Figure 4.
Acceptance of IEQ components. Orange represents non-IEQ-certified, green represents IEQ-certified.

Figure 5.
Annual average IEQ scores of the investigated cases.

Figure 6.
Cost ratios of the investigated cases.

Figure 7.
Analysis of the three aspects in R1 scores. The relationships between building energy cost and (a) envelope thermal performance (R11), (b) HVAC system efficiency, and (c) lighting system efficiency.
Figure 7.
Analysis of the three aspects in R1 scores. The relationships between building energy cost and (a) envelope thermal performance (R11), (b) HVAC system efficiency, and (c) lighting system efficiency.

Figure 8.
Scores of φ2 and VRratio of the investigated cases.

Figure 9.
Analysis results of indoor illumination for the investigated cases.


Table 1.
Previous studies comparing the performance of GBs and CB.
| Study | GBC | Country | Finding | ||||||
|---|---|---|---|---|---|---|---|---|---|
| Acoustic | Visual | Thermal | IAQ | IEQ | Health | Productivity | |||
| [28] | GBL | China | ◎ | ◎ | ◎ | ◎ | ◎ | -- | -- |
| [29] | KGBCC | South Korea | ◎ | ◎ | ◎ | ◎ | ◎ | -- | -- |
| [30] | LEED | U.S. | ◎ | ◎ | ◎ | ◇ | ◎ | ◎ | ◎ |
| [31] | LEED | U.S. | ◎ | ◎ | ◎ | -- | ◎ | -- | ◎ |
| [32] | Green Mark | Singapore | ▽ | ◎ | ◎ | ◎ | ◎ | ◎ | -- |
| [33] | LEED | U.S. | ▽ | ▽ | ◎ | ◎ | ◇ | -- | -- |
| [34] | Green Star | Australia | ◇ | ◇ | ▽ | ◇ | ◇ | -- | -- |
| [35] | LEED | China | ◇ | ◇ | ◇ | ◇ | ◇ | -- | -- |
| [36] | LEED & GBL | China | ◇ | ▽ | ◇ | ◇ | ◎ | ◎ | ◎ |
| [37] | LEED | U.S. | ▽ | ▽ | ◎ | ◎ | ◇ | -- | ▽ |
| [38] | EEWH | Taiwan | ◎ | ◎ | ◎ | ◎ | ◎ | -- | -- |
| [39] | Green Star SA | South Africa | ◇ | ◇ | ◇ | ◎ | ◇ | ◇ | ◇ |
| [40] | BREEAM | U.K. | ▽ | ▽ | ▽ | ▽ | ▽ | -- | -- |
| [41] | LEED | Brazil | ◇ | ◇ | ◇ | ◇ | ◇ | -- | -- |
◎: GBs perform better; ▽: CBs perform better; ◇: No significant difference between GBs and CBs; --: The variable is not considered.
Table 2.
Locations, energy savings, and IEQ scores of the investigated cases.
| Cases | Floor Area (m2) | Energy Savings (R1) | IEQ | Locations | ||
|---|---|---|---|---|---|---|
| Envelope (R11) | HVAC (R12) | Lighting (R13) | (R2) | |||
| P-1 | 14,497 | 8.0 | 8.3 | 5.5 | 6.1 | |
| P-2 | 11,344 | 9.3 | 7.2 | 4.1 | ||
| P-3 | 49,360 | 9.2 | 7.4 | 3.8 | 3.0 | |
| P-4 | 6825 | 12.0 | 4.1 | 2.1 |  | |
| P-5 | 9840 | 8.0 | 7.8 | 4.5 | 5.4 | |
| T-1 | 36,912 | 9.1 | 5.5 | 2.9 | 6.5 | |
| T-2 | 14,776 | 8.7 | 6.0 | 5.6 | 5.4 | |
| T-3 | 1822 | 8.0 | 7.2 | 4.0 | ||
| T-4 | 4956 | 9.2 | 3.2 | 2.5 | ||
| T-5 | 11,371 | 12.0 | 5.8 | 4.3 | ||
| C-1 | 35,093 | 8.1 | 4.1 | 4.4 | 7.2 | |
| C-2 | 15,182 | 8.4 | 3.2 | 2.1 | ||
| C-3 | 10,231 | 10.6 | 3.9 | 2.4 | ||
| C-4 | 74,094 | 8.2 | 3.0 | 5.8 | ||
| S-1 | 19,543 | 9.0 | 2.3 | 1.2 | ||
| S-2 | 15,815 | 8.0 | 3.9 | 5.8 | ||
| E-1 | 5472 | 11.8 | 7.8 | 3.5 | 3.0 | |
| E-2 | 2501 | 12.0 | 6.2 | 6.0 | ||
| E-3 | 4387 | 9.0 | 3.0 | 4.4 | ||
| E-4 | 10,544 | 8.3 | 2.3 | 4.6 | ||
Table 3.
Compilation of scores for energy savings of EEWH office buildings.
| R1 Aspects | Essential Conditions | Rating Score Calculation | ||
|---|---|---|---|---|
| Basis | Benchmark | Equation | Upper Limit | |
| Envelope (R11) | EEV | ≤0.8 | R11 = 31.3 − 36.6 EEV | 12 |
| HVAC (R12) | EAC | R12 = 20.1 − 23.3 EAC | 14 | |
| Lighting (R13) | EL | R13 = 10.5 − 13.1 EL | 6 | |
| Total | R1 = R11 + R12 + R13 | 34 | ||
Table 4.
Evaluation contents for IEQ in EEWH with rating scores and weights.
| Item | Evaluation Contents and Allocation | Subtotal (Xi) | Weight (Yi) |
|---|---|---|---|
| Acoustics | ability of sound insulation of walls, windows, and slabs | 100 | 0.2 |
| Visual | visible transmittance of glass, daylight availability, anti-glare device | 100 | 0.2 |
| Ventilation | ability of providing natural or mechanical ventilation | 100 | 0.2 |
| Furnishing | amount of furnishing, usage of recycled/green materials | 100 | 0.4 |
Publisher’s Note: MDPI stays neutral with regard to jurisdictional claims in published maps and institutional affiliations. |
© 2022 by the authors. Licensee MDPI, Basel, Switzerland. This article is an open access article distributed under the terms and conditions of the Creative Commons Attribution (CC BY) license (https://creativecommons.org/licenses/by/4.0/).
Share and Cite
MDPI and ACS Style
Hwang, R.-L.; Chen, W.-A.; Weng, Y.-T. Strengthening Taiwan’s Green Building Certification System from Aspects of Productivity and Energy Costs to Provide a Healthier Workplace. Atmosphere 2022, 13, 118. https://doi.org/10.3390/atmos13010118
AMA Style
Hwang R-L, Chen W-A, Weng Y-T. Strengthening Taiwan’s Green Building Certification System from Aspects of Productivity and Energy Costs to Provide a Healthier Workplace. Atmosphere. 2022; 13(1):118. https://doi.org/10.3390/atmos13010118
Chicago/Turabian StyleHwang, Ruey-Lung, Wei-An Chen, and Yu-Teng Weng. 2022. "Strengthening Taiwan’s Green Building Certification System from Aspects of Productivity and Energy Costs to Provide a Healthier Workplace" Atmosphere 13, no. 1: 118. https://doi.org/10.3390/atmos13010118
Note that from the first issue of 2016, this journal uses article numbers instead of page numbers. See further details here.