
Analysis and Optimization of an Expansion Energy-Absorbing Anti-Crawler for Rail Vehicles

1
Key Laboratory of Traffic Safety on Track, Ministry of Education, School of Traffic & Transportation Engineering, Central South University, Changsha 410075, China
2
Joint International Research Laboratory of Key Technology for Rail Traffic Safety, Central South University, Changsha 410075, China
3
National & Local Joint Engineering Research Center of Safety Technology for Rail Vehicle, Central South University, Changsha 410075, China
*
Author to whom correspondence should be addressed.
Sustainability 2023, 15(7), 6288; https://doi.org/10.3390/su15076288
Submission received: 29 December 2022
/
Revised: 27 March 2023
/
Accepted: 28 March 2023
/
Published: 6 April 2023
(This article belongs to the Special Issue Recent Advances in Dynamic Mechanical Properties of Materials and Structures)
Abstract
:This paper describes the crashworthiness optimization of an intumescent energy-absorbing anti-crawler, which was applied to anti-crawling devices for rail vehicles. The energy absorption characteristics of the expansion-type energy-absorbing anti-crawler were studied experimentally, a finite element model (FEM) was established, and the finite element simulation results were verified with the experimental results. In this paper, the response of the expansion structure was predicted using a validated finite element model. Then, the effects of the variables (expansion tube thickness (T), friction coefficient (μ), and slope angle of conical mandrel (α)) on the response were sampled using the design-of-experiments (DOE) method, including a full factorial design and a central composite. Based on these samples, an alternative model was developed using the moving least-squares method (MLSM). Using the results from the full factorial design for main effects analysis, T was found to have the most significant effect on the average force (Favg), while α had the greatest effect on the specific energy absorption (SEA). The Favg, fracture strain, thickness, taper, and friction coefficient of the structure were used as constraints, and the multiobjective genetic algorithm (MOGA) method was used for parameter optimization to obtain a higher SEA. Finally, the best parameters (T = 5.76 mm, μ = 0.178, α = 25°) with an SEA value of 36.52 kJ/kg were obtained. The SEA value was increased by 31.70% compared to the initial results.
1. Introduction
With the increase in railroad speed, the design of vehicle crashworthiness has received increasing attention from researchers [1]. In order to protect passengers from injuries in the event of a collision, various energy-absorbing structures have been designed and installed in the unmanned area of railcars [2,3,4,5]. Deformable circular tubes are an important type of energy absorption, and researchers have conducted numerous studies on the energy absorption methods of circular tubes, such as axisymmetric collapse [6,7,8,9], nonaxisymmetric collapse [10,11,12], and inversion collapse [13,14]. In addition, the expansion of deformable circular tubes under axial compression is another effective energy absorption process [15]. Compared with other collapse modes, the expansion-deformation process of deformable circular tubes under axial compression has a relatively smooth impact force.
The energy absorption characteristics of expanded tubes have been extensively studied by researchers. Yan et al. [16] proposed a theoretical analytical model that takes into account the shear deformation due to bending. Abri et al. [17] developed an analytical and numerical model to describe the expansion process of thick-walled solid tubes based on kinematic and equilibrium conditions. The authors also found that the tube bends at lower punch angles and higher expansion rates. Seibi et al. [18] conducted experimental and numerical studies on steel and aluminum tubes and observed the springback phenomenon at the tip of the expanded tubes. Yang et al. [10] experimentally and numerically investigated the energy absorption of round 5A06 aluminum tubes flared and expanded with four different tapered-cylindrical dies. Li et al. [19] studied the expansion structure under the axial load of rail vehicle hooks and optimized the expansion tube by experimental and numerical studies.
Relevant researchers have also conducted research on the energy-absorbing structure of anti-crawler. Yue et al. [20] proposed a new type of anti-crawling device—pulling anti-crawler, and a set of systematic theoretical evaluation methods for energy-absorbing characteristics, and further proposed specific theoretical calculation model evaluation methods. Gao et al. [21] presents an experimental investigation of a new type of energy absorber that works on the principle of active–passive integration. The absorber consists of a crush tube, anti-climber gear, die, support tool, guide tube, and reversible actuator. Before collision, the crush tube of the absorber is extended duo to the effect of the reversible actuator, which breaks through the coupler restrictions on the longitudinal dimension of the absorber and significantly increases the deformation stroke of the absorber. Muhammad et al. [22] studied a new anti-climber structural concept for a light-rail transit crash-energy management system which is intended to improve passive safety performance that reduces the risk of overriding during a car-to-car collision.
The most influential parameter is the anti-climber material (29.79%) for the system’s crash energy absorption performance and teeth thickness (50.26%) for the crashbox-deforming performance. Guan et al. [23] investigated comprehensively the crashworthiness of shrink circular tube energy absorbers with anti-climbers under vertical, horizontal, eccentric, and oblique loads. Wang et al. [24] designed an improvement method with a cross-structure inside the anti-climber. Gao et al. [25] proposed a shrinkage tube energy-absorbing anti-crawler in which the energy-absorbing structure is suitable for a large eccentric distance collision and inclined collision conditions, and the key structural design parameters have a great influence on the energy-absorbing characteristics and collision resistance of the energy-absorbing structure. Zhou et al. [26] found that under some unknown conditions the energy-absorbing capacity and anti-overriding function of anti-climber are greatly reduced due to serious vertical buckling. In order to analyze the vertical buckling mechanism of collided anti-climber, a simulation strategy based on the coupling finite element method and multibody dynamics is proposed in this paper. A numerical model of anti-climber is established and validated with the quasi-static crush test.
However, most studies of anti-crawlers only focus on parameter optimization of thin-walled structures, honeycomb, cutting-type structures, or composite structures, and there are few studies at home and abroad on parameter optimization and crashworthiness of expansion-absorbing anti-crawlers. The purpose of this paper is to study expansion-absorbing anti-crawlers and optimize the configuration of expansion tubes in the design of anti-crawler crashworthiness through optimization methods.
2. Experimental Testing and Finite Element Simulation
2.1. Expansion Energy-Absorbing Anti-Crawler
Anti-crawlers were widely used in subway trains, and were placed in the front of the train together with the coupler, as shown in Figure 1. In order to absorb the energy brought by the impact of the train to achieve the role of protection and safety, the front end of the subway train was set up with a hook and two anti-crawlers, where the hook, as the main energy-absorbing and connecting device, was not fully functional in some cases, and at this time the anti-crawlers were needed to act in the role of preventing crawling and auxiliary energy absorption. The specific location of the hooks and anti-climbers are shown in the red box.
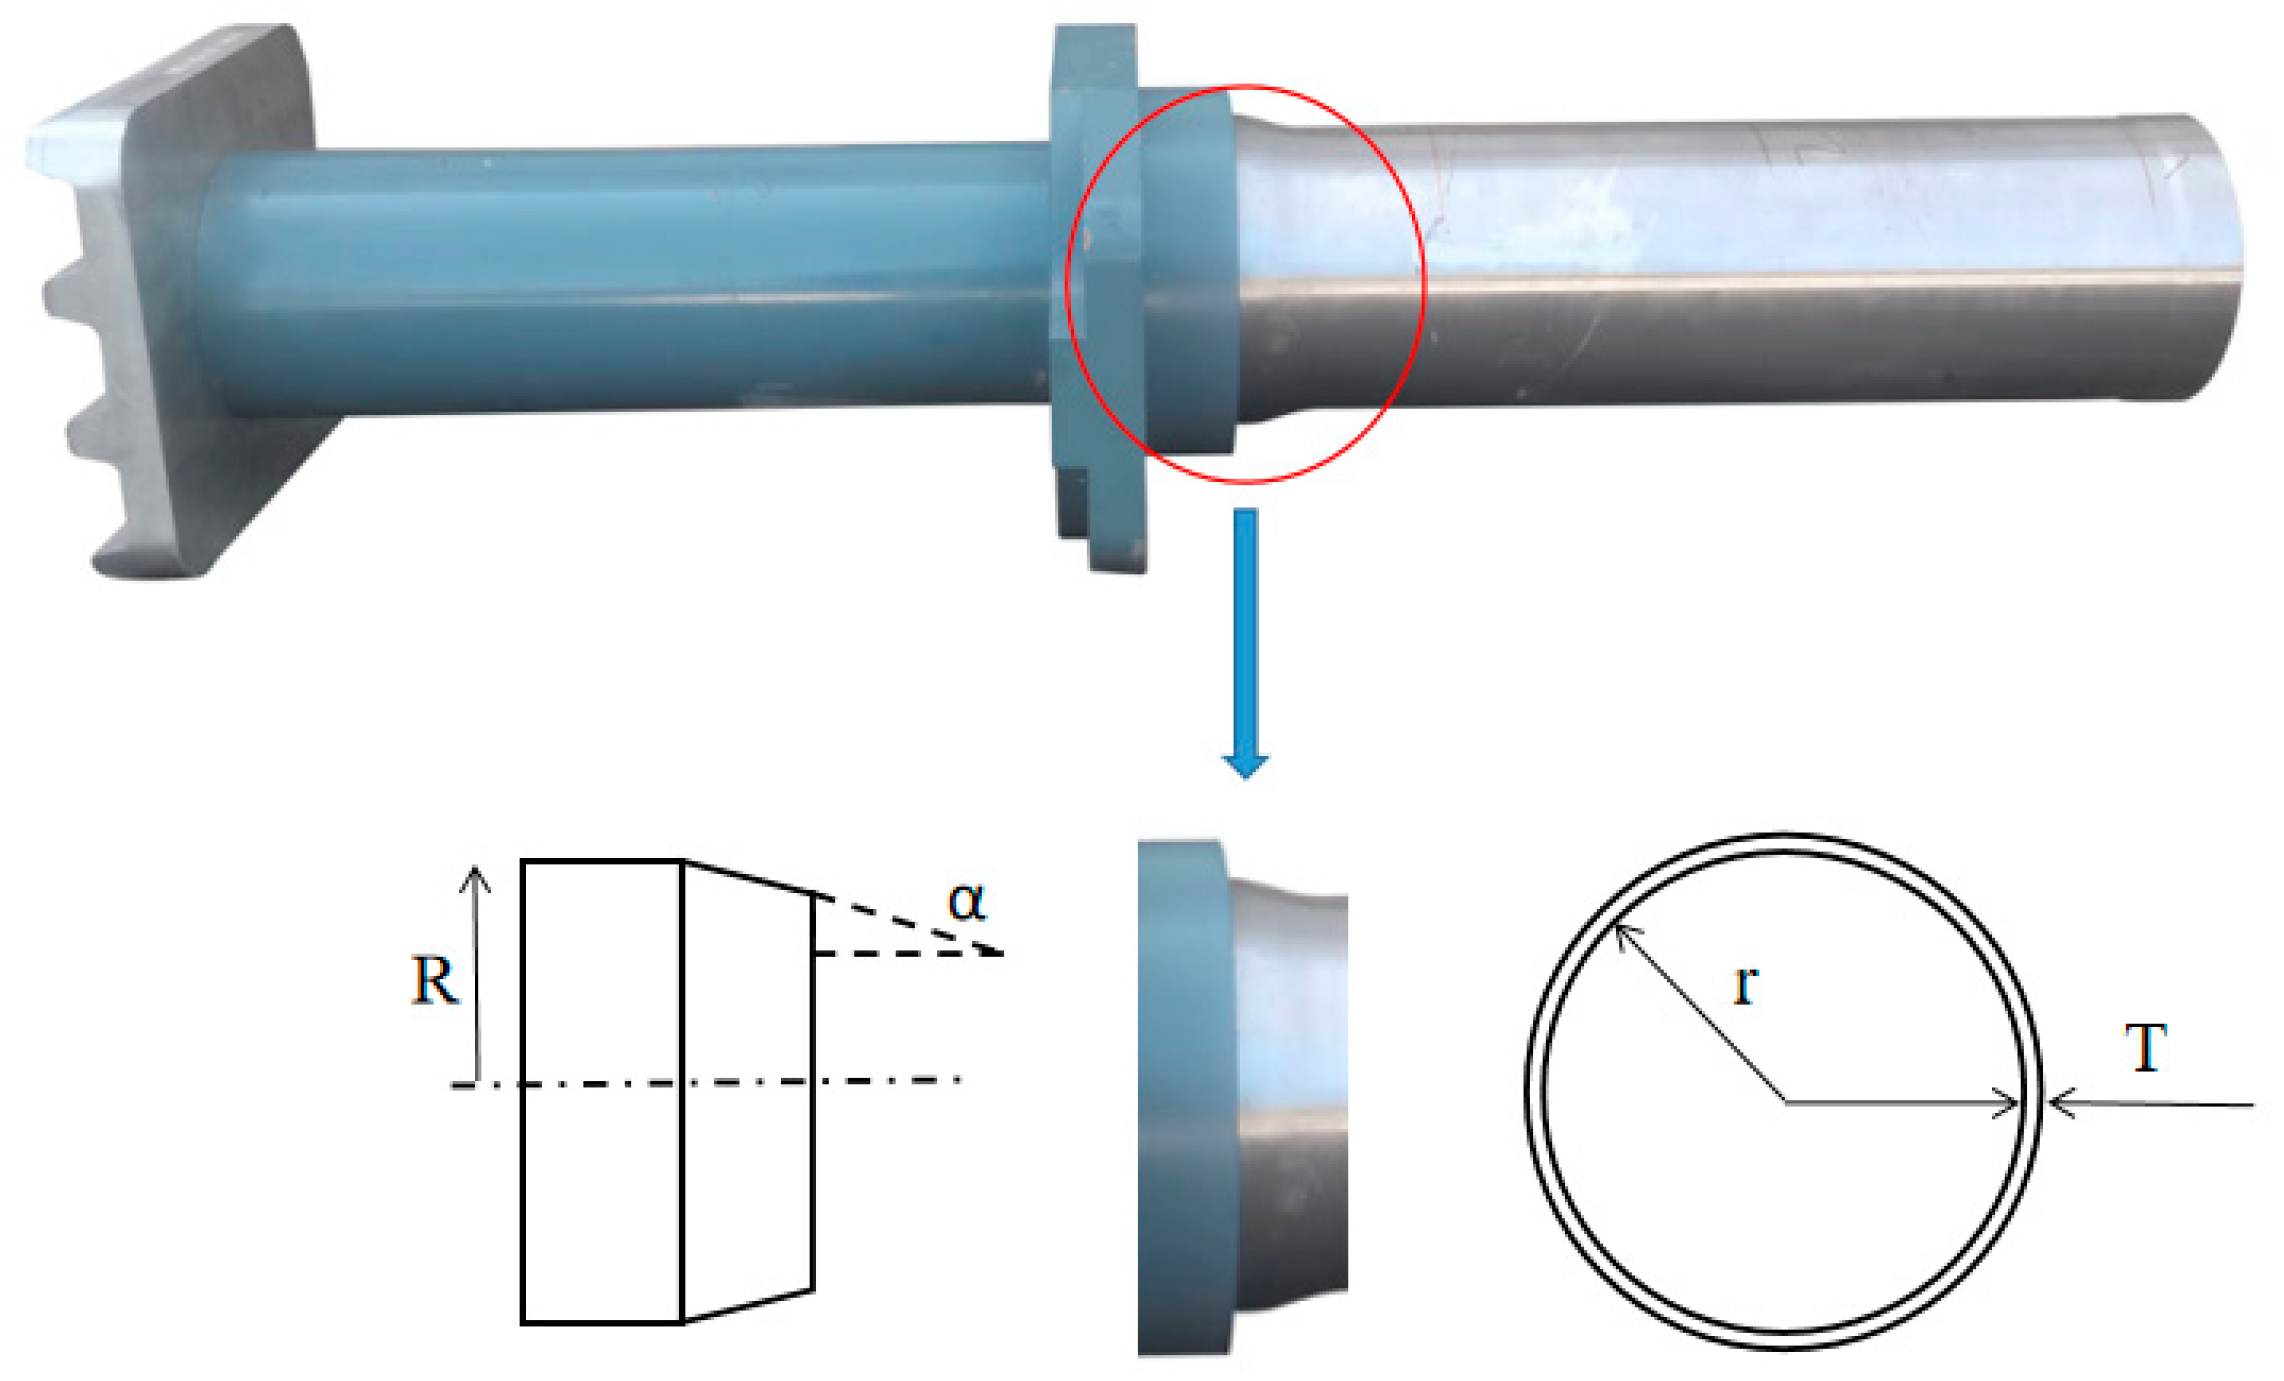
Circular expansion tubes have been very suitable for use in energy absorption as part of an anti-crawler, which is an important energy-absorbing structure on rail vehicles, as shown in Figure 2. The expanding energy-absorbing structure consists of two parts, a deformable tube and a conical mandrel. The ends are flared and a flange holds the connection between the deformable tube and the tapered mandrel. The deformable tube (350 mm long, 6 mm thick) fits well into the tapered part of the mandrel (15° bevel angle). Figure 2 shows the thickness T of the deformable tube, the inner radius r of the deformable tube, the slope angle α, and the outside radius R of the conical mandrel. The main geometrical dimensions of the energy-absorbing structure of the anti-crawler are listed in Table 1.
2.2. Experimental Test
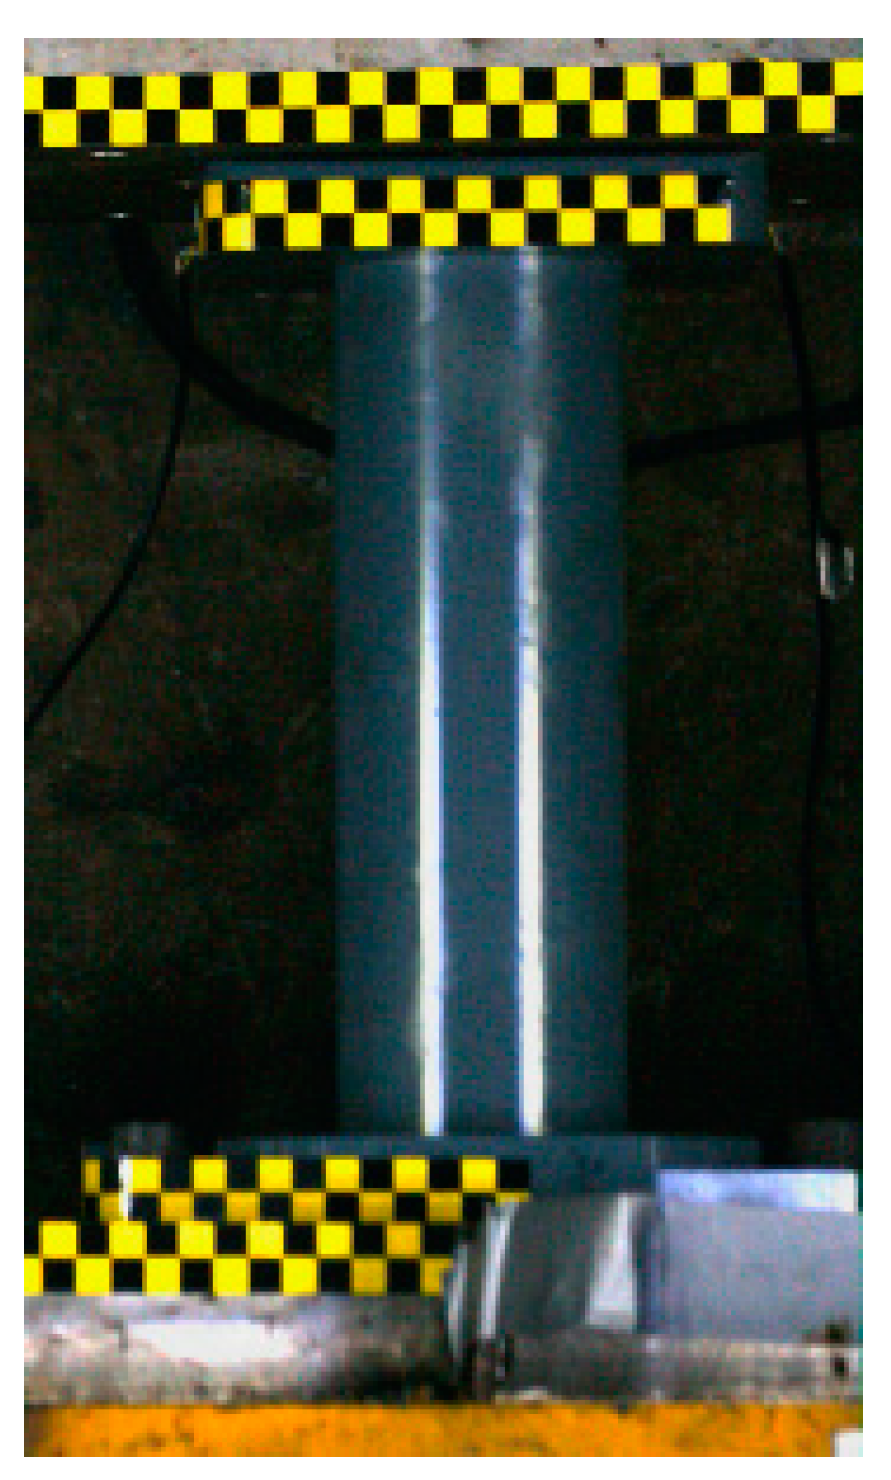
In order to study the performance of the energy-absorbing structure under impact conditions, a crash test was performed, as shown in Figure 3. The authors designed a special device to mount the anti-crawler, which was fixed to a trolley. The assembly was mounted in front of the force-sensing wall to allow accurate recording of transient impact forces. A speed sensor was placed at the impact location to record the velocity under impact conditions. High-speed digital cameras were placed to the left and above the impact position to capture the deformation state of the specimen during the impact. Considering the sufficient kinetic energy required for deformable tube deformation, the authors designed the collision test speed to be 6.865 m/s. At the time of collision, the trigger system sent signals to the high-speed camera system and the transient impact force test system to start recording.
When studying the crashworthiness of the expansion energy-absorbing anti-crawler under dynamic impact, every node of its experimental design is crucial. As shown in Figure 4a, in order to perfectly test the expansion energy-absorbing anti-crawler, sensors are placed at the rear of the steel wall to precisely measure its longitudinal force, and the expansion anti-crawler is mounted and fixed to the vehicle body by means of a flange, and the deformable tube is expanded by means of a tapered tube at the front end, without any fixture placed behind the deformable tube. The car body and the expanding energy-absorbing anti-crawler are one piece for the experiment, and the initial velocity is obtained through the air cannon at the rear (Figure 4b). Since the target of the test is the expanding anti-crawler, the car body at the rear is equivalent to a rigid body, and no deformation or derailment, etc., will occur in the event of a collision at the initial velocity.
According to the above test arrangement and behavior analysis, the specific test results are shown below.
Figure 5 shows the time–displacement curve of the test; it can be found that when the time reaches 40 ms, the displacement is 235 mm and the curve is relatively smooth, indicating that for the entire test process the expansion tube is behaves consistently and exhibits a smooth expansion of energy absorption.
Figure 6 shows the velocity–time diagram for the collision test of the expansion anti-crawler with an initial velocity of 6.865 m/s. Owing to the complex test conditions, friction, air resistance, and other conditions at the beginning of the collision, the initial velocity is 6.842 m/s; the velocity has a small fluctuation. With the passage of time, the velocity time gradually decreases until 40 ms; at the end of the collision, the expansion energy absorption device completes the energy absorption. At this time, the velocity is 5.246 m/s. The expansion-type anti-crawler cannot completely absorb the kinetic energy of the test piece, so the collision is completed by the collision car on both sides of the auxiliary energy-absorbing device to absorb all the energy before the end.
From Equation (1), the absorption energy of the expansion energy-absorbing anti-crawler is calculated as 128.58 kJ. Therefore, the auxiliary energy absorption device absorbs the remaining 183.42 kJ of energy, and the auxiliary energy absorption consists of 9 tubes on each side, a total of 18; the average energy absorption of each auxiliary energy absorption tube is 20.38 kJ.
where E1 is the initial kinetic energy of the overall specimen; E2 is the kinetic energy of the overall specimen after the expansion anti-crawler finished absorbing energy; M is the weight of the overall specimen; v1 is the initial velocity of collision; and v2 is the velocity of the overall specimen after the expansion anti-crawler finished absorbing energy.
Figure 7 shows the force displacement graph and energy displacement graph of the test, taking the collision that just occurred as the initial moment, at 0~14.254 mm; the force value rises extremely fast and reaches the highest value of 740.77 kN, and then starts to fall until the stroke is 34.31 mm, the force value starts to stabilize, taking 34.31~235 mm as the value interval of steady-state force. The steady-state force of the expansion energy-absorbing anti-crawler is 552.79 kN. The consistent and smooth expansion tube force results from the collision of the collision tube in the whole impact process. Thus, the energy absorption is also stable with the increase in displacement, and the energy absorption is completed at 235 mm, which is 128.57 kJ.
2.3. Building the Finite Element Model
- (1)
- Theoretical analysis of energy absorption characteristics
A section in the deformed area of the expanded energy-absorbing structure is selected for the analysis, and a circular ·one-dimensional element body is intercepted in two planes perpendicular to the axis of the circular tube, as shown in Figure 8. Let the dimensional parameters of the collapsed tube be: 2R0 is the outer diameter; 2r0 is the inner diameter; t is the wall thickness, after the expansion deformation; 2R1 denotes the outer diameter; 2r1 denotes the inner diameter; α denotes the cone angle of the conical mandrel; σx denotes the axial compressive stress; σm denotes the radial compressive stress; and σγ denotes the circumferential compressive stress. Then, the equilibrium equation for the basic body in the axial direction is given by Equation (2):
Equation (3) omits the higher order differentials:
where μ is the coefficient of friction between the expanded energy-absorbing structure and the tapered mandrel.
In Equation (4), assume that is the combined stress of the radial compressive stress σm and the friction stress of the circular primitive body:
Simplifying gives Equation (5):
Assuming that the thickness of the expansion tube pipe is constant during the energy absorption process of the expansion energy-absorbing device, the corresponding yielding conditions are given by Equation (6):
where K is the plane deformation resistance, , and is the corresponding yield stress of the material.
The force analysis of the circular primitive body (taken in half) is shown in Figure 9.
The equilibrium equation in the vertical direction is given by Equation (7):
In Equation (8), substituting Equation (6) into Equation (5):
In Equation (9), substituting Equation (8) into Equation (5):
In Equation (10), substituting Equation (9) into Equation (3):
where: is regarded as the combination parameter of the friction coefficient between the inner wall of the expansion tube and the cone head, and the cone angle α of the cone head of the expansion energy absorption structure.
Integrating Equation (9) and substituting the boundary conditions R = R1, r = r1 when σx = 0, the expansion stress of the expansion tube should be obtained as in Equation (11):
where .
From Equation (10), the steady-state force of the expansion tube of the expanded energy-absorbing structure is given by Equation (12):
where L is the length of the expansion tube in the expansion energy-absorbing device and τ is the action stroke of the expansion tube in the expansion energy-absorbing device.
- (2)
- Finite element model
The intumescent energy-absorbing anti-crawler structure absorbs energy mainly by the expansion of deformable tubes. Except for the deformable tube, the other parts of the expanded energy-absorbing anti-crawler structure absorb and deform minimally during the expansion process, and they are considered as rigid bodies. The simplified FE model consists of deformable tubes, flanges, tapered mandrels, anti-crawl teeth, and rigid wall, and the weight of the overall specimen is 13.33 t, all attached to the rigid wall, and the whole process is simulated by giving the rigid wall an initial velocity V to push the anti-climbers to expand and absorb energy, as shown in Figure 10.
The rigid wall was used to substitute the test trolley. In this study, LS-DYNA, the base of the conical tube was fully fixed; a rigid wall, whose normal direction was parallel to the axial direction of the tubes, was set on the side of the deformable tube. The simulation was specified with an initial velocity, 6.865 m/s, to simulate dynamic loading. The mass of the rigid wall was set to 13.33 t. To better simulate the characteristics of deformation, an eight-node brick element with one point integration was adopted. Based on studies by Yao et al. [20], it was found that an expansion tube with an element size of 2 mm was able to ensure an accurate deformation process.
Only one type of contact algorithm was employed in the FE models. The automatic surface to surface contact algorithm (AUTOMATIC_SURFACE_TO_SURFACE) was used for every contact.
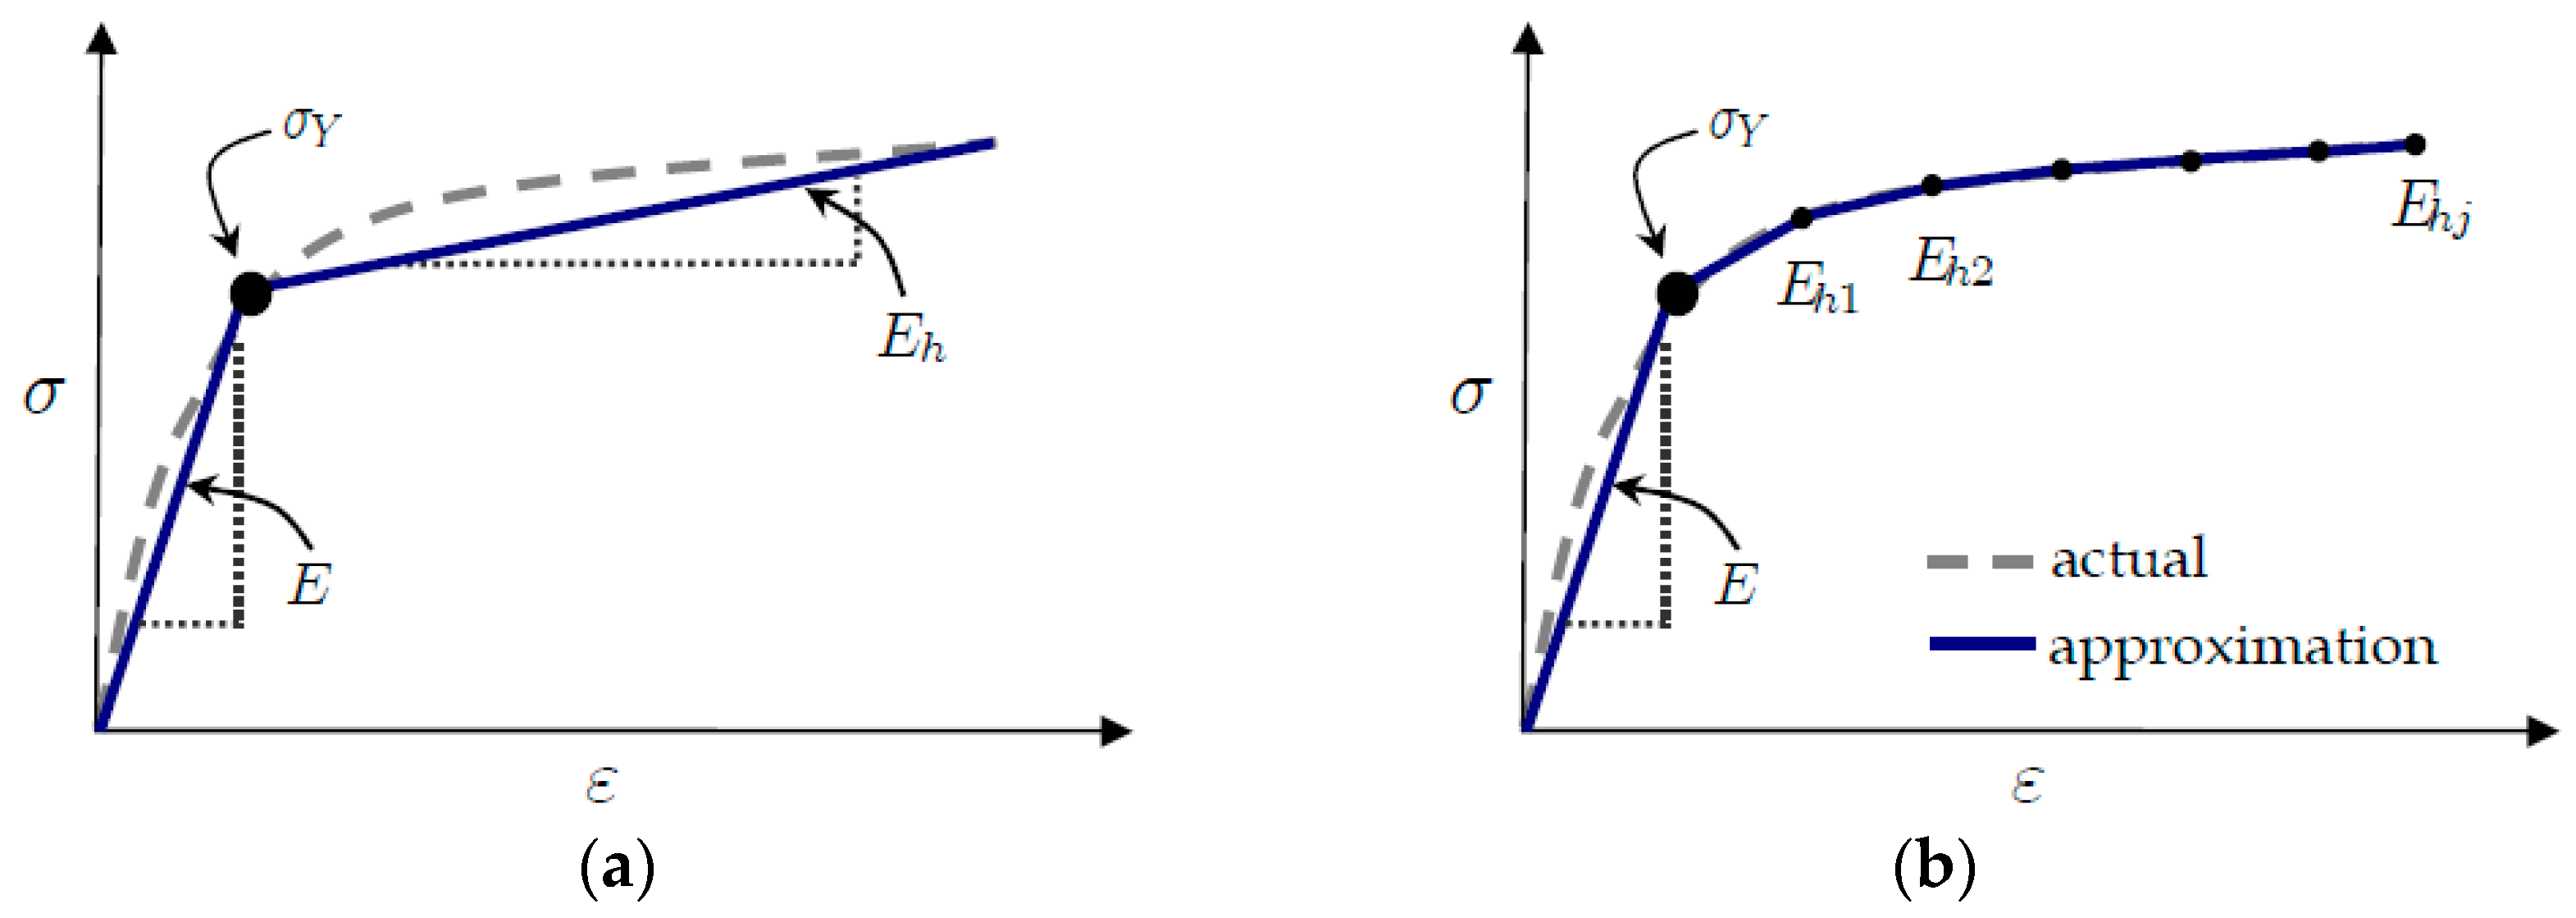
The material is high-strength steel modeled by an elastic–plastic constitutive model. The elastic–plastic constitutive model has been well developed and widely used in engineering application, which can be described by five key parameters: density (ρ), Young’s modulus (E), yield stress (σY), strain hardening modulus (Eh), and Poisson’s ratio (ν). The elastic–plastic material behavior can also be modeled in LS-DYNA® by using “*MAT_024_PIECEWISE_LINEAR_PLASTICITY” (shown in Figure 11).
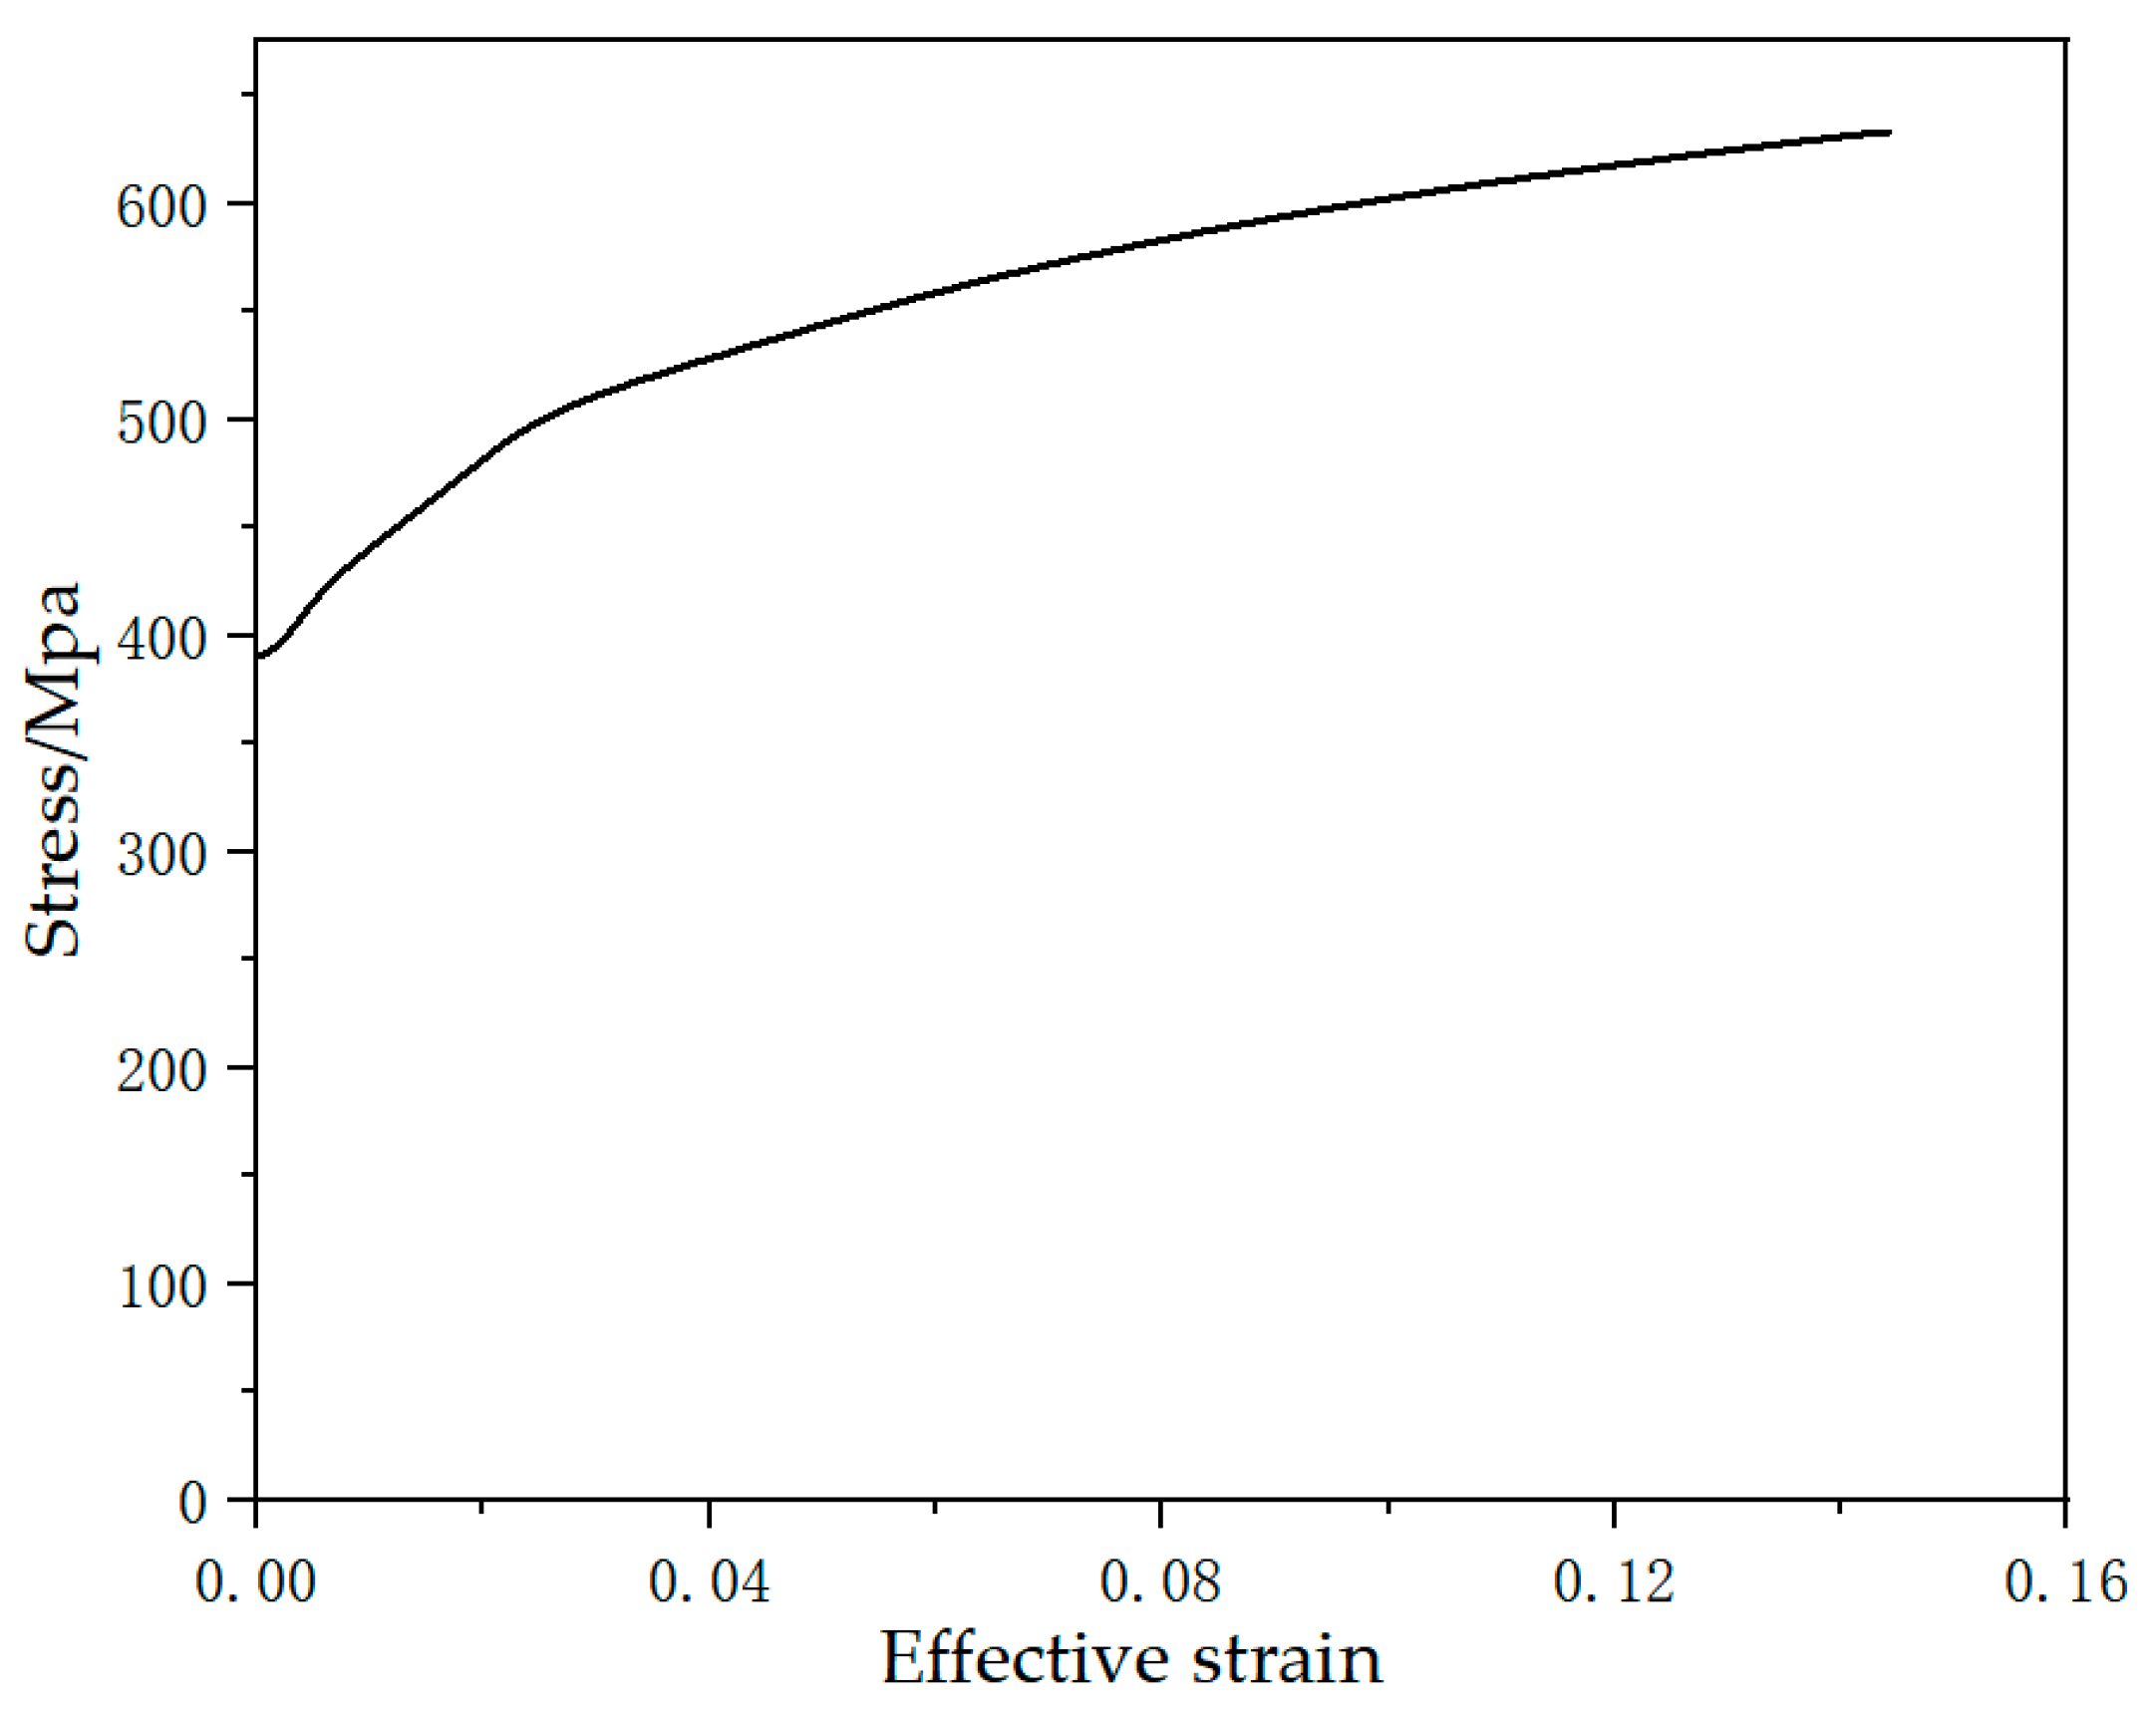
The material of the deformable tube should have a certain mechanical strength and sufficient deformation capacity; therefore, the authors set the yield strength of the material to σY = 390 MPa, Young’s modulus to E = 210 GPa, and Poisson’s ratio to ν = 0.3. Figure 12 shows the effective stress–strain relationship obtained from the tensile test. Since the tapered mandrel has almost no deformation during the collision, it is considered as a rigid body. The authors used “MAT_024_PIECEWISE_LINEAR_PLASTICITY” from the material library in LS-DYNA to define the material of the deformable tube, and “MAT_RIGID” was applied to the conical mandrel. The coefficient of friction (μ) between the deformable tube pipe and the tapered mandrel is 0.1.
2.4. Validation of the FE Mode
The boundary conditions of the FE model were set according to the test conditions, except when simplifications were necessary. The results of the simulation and the experiment were compared to validate the precision of the FE model.
Figure 13 shows the comparison of the deformation between the experiment and simulation. Both the experimental and simulated expansion tubes have the same ordered and controlled deformation.
A high-speed photograph is shown in Figure 14. Since the expansion process of the expansion tube in the anti-crawler takes place inside the car body during the experiment, the corresponding control diagram of the expansion process cannot be obtained, so the expansion behavior for the experiment and simulation in the two states, initial and end, are compared.
Consistent with the results for the simulation and experiment, when both the test and simulation take the frequency of 500,000 HZ, the loading force went through four stages on the expansion tube, as shown in Figure 15. The experimentally obtained force rises rapidly, reaches a maximum value, then drops sharply, and finally stabilizes. The force obtained from the simulation also increases rapidly, then decreases sharply, and finally tends to stabilize, which is approximately the same throughout the deformation pattern. The reason for the difference is that during the motion of the car body, the force majeure factors, such as the track and the force measuring plate produce oscillation, which cause a large peak force and make the rise to the peak curve steeper, making both the experiment and the simulation rise to the peak force at 0 ms. Although the influence of experimental conditions leads to a slightly different rising trend, it does not affect the consistency of the final experiment and simulation in terms of rising time and steady-state force. When the expansion process is stable, the impact force also tends to be stable. The steady-state forces of 552.91 and 558.24 kN for the impact experiments and finite element simulations are consistent, respectively. In addition, the equivalent absorbed energy is consistent, and the experimental and simulated values are 128.57 and 133.93 kJ, respectively. From this discussion, it is clear that the simulation results are in good agreement with the experimental results. In summary, the finite element model and the impact experiments are accurate due to their good agreement and can be used for further analysis.
3. Approximate Model and Factorial Analysis
3.1. Design of Experiments (DOE)
Design of experiments (DOE) has been used for a long time in optimization research. DOE finds the key factors and controls the factors associated with them by quantifying the structure-related parameters. The design process of DOE is to discover the relevant influencing factors for output response changes by making purposeful changes to the relevant parameters of the process or system according to the actual requirements. The design steps of DOE are as follows: (1) Determine which variables have the greatest impact on the response of the target. (2) Determine the location of setting the relevant parameters that can affect the output response so that the response is close to the desired nominal value and the output response is more stable. (3) Build an alternative model.
3.1.1. Variables and Responses
In a train collision, the energy absorbed by the hook buffer is completed, and the energy not yet absorbed is assisted by the anti-crawler for energy absorption work. In order to make the car body not move as well as smooth energy absorption, the energy absorption and average force of the anti-crawler is an important index used to evaluate the crashworthiness of the anti-crawler.
The slope angle of the conical mandrel and the thickness of the deformable tube may influence the crashworthiness of the expanding energy-absorbing structure [28]. The friction coefficient in contact condition could also influence the crashworthiness of the expanding energy-absorbing structure [10]. In this study, the design variables are tube thickness (T), coefficient of friction (μ), and slope angle (α), while keeping the maximum radius (R) of the cone mandrel constant.
The purpose of structural parameter optimization is to develop a structure with good impact resistance. Several key indicators, such as energy absorption (EA), specific energy absorption (SEA), and average crash force (Favg), are often used to evaluate crashworthiness [29]. These metrics are defined in Equation (13).
where F(a) represents the instantaneous crashing force function and x1 and x2 are the displacement of the anti-climber at the beginning and end of the collision, respectively.
As the name implies, SEA evaluates the energy that a structure can dissipate per unit of mass; SEA is defined in Equation (14):
M1 is the mass of the expansion energy-absorbing anti-crawler.
3.1.2. Sampling Design
To find the relationship between the three variables studied by the authors and the energy absorption capacity of the anti-crawler expansion energy absorption device, the authors chose a range of variables that satisfied the practical situation. The parameter friction (μ) was changed from 0.04 to 0.2, set to five levels. The range of slope angle (α) was set from 10° to 25°, set to four levels, depending on the contact conditions. Owing to the design of the anti-crawler expansion energy-absorbing device, there is a flange above for fixed restraint, and also the required force value cannot be too large, so the thickness (T) of the expansion tube ranges from 5 to 8 mm, which is set to seven levels. These levels are orthogonal to each other and produce a full-analysis factor design matrix. The total number of experiments in the full-analysis design is 140, and the details are shown in Table 2.
In this experimental design, a central composite design (CCD) was applied to provide a validation matrix for the alternative model. Central composite design (CCD) consisted of an embedding or fractional factor design with a centroid that is enriched by a set of “star points” that allow estimating the curvature, and a central composite design always contained twice as many star points as the number of factors in the design. The star points represent new extreme values for each factor in the design. The total number of runs in CCD was a function of the number of design variables. The calculation formula is given by Equation (15):
where N is the number of runs and n is the number of design variables. The values of , , and refer to the numbers of factorial points, center points, and star points, respectively.
If the distance between a factorial point and the center of the design space is ±1 unit for each factor, then the distance between a star point and the center of the design space is ± with > 1. To ensure the consistency of the variance, a rotatable design model was chosen to be used. It can satisfy the requirement of rotation by properly choosing the values of . In a rotatable design, is calculated by Equation (16):
An inscribe-type CCD, in which there is no need to consider points outside the design range, was adopted for this study.
3.2. Main Effects
Main effects are a one-sided response impact analysis of an independent variable corresponding to the variable, ignoring the effect of any other independent variables, and the degree of main effects can be expressed in linear form. Linear effects are calculated by linear regression equations, which are normalized so that their standard design variables are (0, 1], then the equation for the linear effect of the independent variable y on the response f(y) is defined by Equation (17):
The linear effect can be presented in the form of an icon in which the line tends to be horizontal, meaning that the design variables have little effect on the associated response, and when the line tends to be vertical, the degree of effect tends to be greater. The positive slope represents that an increase in the parameter value will directly affect the change in the response by making it grow, and the negative slope is the opposite.
Figure 16 shows the main effects plot obtained by DOE analysis, from which it can be seen that the variable T has the greatest effect on Favg, while the cone angle α has the greatest effect on SEA.
3.3. Approximate Model
The authors used the least-squares method (MLSM) for the response-surface fitting work. MLSM is a generalized algorithm for the traditional least-squares method, LSM. MLSM builds a weighted least-squares model, which compared to the traditional least-squares method (LSM), does not have a constant weight for each sampling point. In LSM, the regression coefficient vector γ is defined by Equation (18):
where B is a matrix constructed by the input value of DOE and W is the weighting factor corresponding to each sampling point, which represents the importance of the corresponding sampling points.
MLSM builds a weighted least-squares model. In the model, the weights associated with the sampling points do not remain constant compared to LSM. Instead, they are functions of the normalized distance from a sampling point to a point xi at which the surrogate model is evaluated. Each weight decays as its corresponding evaluation point is moved away. MSLM defines a decay through a decay function.
This study is a single-objective optimization problem, and MLSM is precisely suitable for such problem solving and can effectively construct response-surface models. Compared with SLM, MLSM fitting is more complex and effective, but the computation time is as short, so using MLSM for response-surface fitting is recommended. Based on the results of DOE, the response surface created by MLSM is shown in Figure 17.
As shown in Figure 9, from (a), (b), and (c), we can see that the effects of T, μ, and α on Favg are all linearly and positively correlated. From (d), (e), and (f), it can be learned that the effects of the three variables T, μ, and α on SEA show some nonlinearity, with the nonlinear effect of α being the largest.
3.4. Error Analysis of the Approximate Model
The partial residuals of the responses are presented in Table 3 and Table 4, which show the data with absolute percentage errors greater than 0.95% and 5% between the simulated actual values and the predicted values from the MLSM method for Favg and SEA, respectively. The maximum errors of 1.36% for Favg and 9.03% for SEA are less than 10%, indicating that the alternative model fitted with MSLM produces lower residuals for Favg and SEA.
To evaluate the modeling accuracy of the model built by MLSM, the accuracy of the alternative model was verified using the following two parameters from Equations (19) and (20):
where and are the corresponding predicted and average values for the response for each sampling point, and n is the number of test points. In general, the larger the value for R2, the more accurate the model; the smaller the RAAE value, the more accurate the model. From Table 5, we can see that the proxy model has high accuracy, so the optimal design based on the proxy model is convincing.
4. Optimization
4.1. Description of Optimization Problem
In the design of the energy-absorbing structure of the subway anti-crawler, structural optimization is very important. Usually, providing the energy absorption of the anti-crawler is the purpose we want to optimize. Therefore, SEA becomes our design goal while maximizing it. In this paper, the design strength of the intumescent energy-absorbing anti-climber is 600 kN, so Favg in the study should be no more than 615 kN. To reduce the design difficulty, Favg is limited to a certain range; the upper limit of Favg is 615 kN. Therefore, the single objective in the optimization is to maximize SEA.
Considering the damage problem of the expanded energy-absorbing anti-crawler, we need to use the breaking strain as one of the constraints. The expansion energy-absorbing structure is axisymmetric, so the stress–strain is the same all around the circular tube with the axis of the circumference as the base point, and the damage strain of the deformable tube material is 0.312. Therefore, we express the single optimization problem of an expanded energy-absorbing structure under axial load as the mathematical expression shown in Equation (21):
4.2. Optimization Algorithm
The multiobjective genetic algorithm (MOGA) is a basic genetic algorithm framework to solve multiobjective problems effectively, which has the characteristics of fast convergence and uniform Pareto front distribution compared with other algorithms such as the multiobjective particle swarm algorithm and the nondominated ranking genetic algorithm. This algorithm has received much attention in recent years and has been successfully applied to structural parameter optimization. Therefore, MOGA is used to solve the multiobjective optimization problem, and the Pareto fronts of the SEA and Favg objective functions can be obtained. The MOGA flowchart is shown in Figure 18, and the relevant parameters are designated in Table 6.
Then, determine the optimal solution by applying Equation (22):
where D is the distance from the optimal solution (knee point) to the ideal point (utopia point); m is the number of objective functions, m = 2; and fik is the objective function k corresponding to the Pareto solution.
Before the optimal solution can be obtained using the “distance minimization” criterion, the set of Pareto solutions must be normalized by the formula given by Equation (23):
where Fi is the normalized value of point i; fi is the optimized value of point i; fmax is the maximum value for the optimized value; and fmin is the minimum value for the optimized value.
4.3. Results and Discussion
In this study, the thickness of the expansion tube (T), the friction coefficient (μ), and the angle of the conical tube (α) are set as independent variables. The fracture strain and the average force are used as constraints, with the only optimization objective for maximizing the specific energy absorption. In this study, MOGA is used as a method to manage this single-objective optimization problem with the design variables within the limits of the DOE matrix and the initial values of the parameters, as in the case when T, μ, and α are smallest.
In the optimization simulation, the optimal values of the three variables were obtained after 50 iterations of global search to obtain the target values. The optimal values of T, μ, and α were 5.76 mm, 0.178, and 25°, respectively. Then, finite element simulations were performed using the optimized parameters to verify the optimization results. Table 7 shows the comparison between the predicted and numerical results. It can be seen that the error percentages are within the acceptable range, so the optimized results were validated.
The comparison of the initial value and the optimized force–time curve is shown in Figure 19. It can be seen that the optimized peak force is higher and rises faster compared to the initial value, indicating that the optimized intumescent energy-absorbing anti-crawler has better mechanical properties, while the optimized intumescent energy-absorbing anti-crawler tends to be smooth at 67 ms. The steady-state force value is 595.98 kN, compared with the initial value at 0.011 s, which tends toward a steady-state force of 558.34 kN; not only is the time required to enter the steady-state force shorter, but the force is also more relatively smooth, which indicates that the optimized result is very successful and significant.
The optimal configuration of the expansion energy-absorbing structure obtained through this study is expected to be used for mechanical product design, so the values of the variables should be acceptable in mechanical production. The values of T, μ, and α are about 5.76 mm, 0.178, and 25°, respectively, within the acceptable range. Table 8 shows the comparison of the variables and response values between the initial and optimal configurations of the expanded energy-absorbing structure. The initial and optimal values of SEA are 27.73 kJ/kg and 36.52 kJ/kg, respectively. The optimized values increase by 31.70%. The optimized specific energy absorption increases substantially, which indicates that this optimized configuration of the energy absorption structure is more suitable for the expanded energy absorption anti-crawler.
5. Conclusions
In this study, the structural parameter analysis and crashworthiness optimization of the expansion energy-absorbing anti-crawler were conducted. In order to study the mechanical characteristics and energy absorption characteristics of the anti-crawler, impact experiments were conducted, finite element models were established, and the accuracy of the models was verified by experimental results.
This study collected a total of 80 samples and performed a parametric analysis using a DOE approach. From these samples, variables and responses were fitted to the response surface by MLSM. It was found from the validation that the alternative model fitted with MLSM had a high accuracy and produced low residuals with the simulation results for Favg and SEA. In addition, the results from DOE showed that the expansion tube thickness had the greatest effect on Favg, and SEA had a large correlation with the expansion angle (α).
Based on the alternative model generated by the MLSM, optimization was performed using the MOGA method to obtain the optimal solution for the highest SEA at a specific Favg and within a specific fracture strain. Finally, the optimal parameters (T = 5.76 mm, μ = 0.178, α = 25°) were obtained. The optimized simulation results showed an SEA of 36.52 kJ/kg, which was an increase of 31.70% compared to the initial results.
Author Contributions
Conceptualization, Z.Z. and P.X.; methodology, Z.Z. and P.X.; software, Z.Z.; validation, Z.Z. and P.X.; formal analysis, Z.Z.; investigation, Z.Z. and P.X.; resources, Z.Z. and P.X.; data curation, Z.Z. and P.X.; writing—original draft preparation, Z.Z.; writing—review and editing, Z.Z. and P.X.; visualization, Z.Z.; supervision, P.X.; project administration, Z.Z.; funding acquisition, P.X. All authors have read and agreed to the published version of the manuscript.
Funding
This research was funded by the National Key Research and Development Program of China, grant number 2021YFB3703801.
Institutional Review Board Statement
Not applicable.
Informed Consent Statement
Not applicable.
Data Availability Statement
Not applicable.
Acknowledgments
Not applicable.
Conflicts of Interest
The authors declare no conflict of interest.
Abbreviations
| Abbreviation | Description |
| T | expansion tube thickness |
| B | matrix constructed by the input value of DOE |
| D | distance from the optimal solution (knee point) to the ideal point (utopia point) |
| E | Young’s modulus |
| EA | energy absorption |
| Eh | strain hardening modulus |
| E1 | initial kinetic energy of the overall specimen, |
| E2 | kinetic energy of the overall specimen after the expansion anti-crawler has finished absorbing energy |
| Favg | average force |
| F(a) | instantaneous crashing force function |
| Fi | normalized value of point i |
| fi | optimized value of point i |
| fik | objective function k corresponding to the Pareto solution |
| fmax | maximum value in the optimized value |
| fmin | minimum value in the optimized value |
| f(y) | equation for the linear effect of the independent variable y on the response f(y) |
| K | plane deformation resistance |
| L | length of the expansion tube of the expansion energy-absorbing device |
| M | overall specimen |
| M1 | mass of the expansion energy-absorbing anti-crawler |
| m | number of objective functions |
| N | number of runs and n is the number of design variables |
| Nc | number of star points |
| 2n | number of center points |
| 2n | number of factorial points |
| R0 | outer diameter |
| R1 | outer diameter after the expansion deformation |
| r0 | inner diameter |
| r1 | inner diameter after the expansion deformation |
| S | combination parameter of the friction coefficient between the inner wall of the expansion tube and the cone head and the cone angle α of the cone head of the expansion energy absorption structure |
| SEA | specific energy absorption |
| t | wall thickness |
| v1 | initial velocity of collision |
| v2 | velocity of the overall specimen after the expansion anti-crawler has finished absorbing energy |
| W | weighting factor corresponding to each sampling point |
| x1 and x2 | displacement of the anti-climber at the beginning and end of the collision, respectively |
| y | equation for the linear effect of the independent variable y |
| corresponding predicted | |
| average values of the response for each sampling point | |
| α | slope angle of conical mandrel |
| γ | regression coefficient vector |
| μ | friction coefficient |
| ν | Poisson’s ratio |
| ρ | density |
| τ | action stroke of the expansion tube of the expansion energy-absorbing device |
| σm | radial compressive stress |
| corresponding yield stress of the material | |
| σx | axial compressive stress |
| σy | yield stress |
| σγ | denotes the circumferential compressive stress |
| combined stress of the radial compressive stress σm and the friction stress of the circular primitive body | |
| distance between a star point and the center of the design space |
References
- Chen, Z.; Zhai, W.; Cai, C.; Sun, Y. Safety threshold of high-speed railway pier settlement based on train-track-bridge dynamic interaction. Sci. China Technol. Sci. 2015, 58, 202–210. [Google Scholar] [CrossRef]
- Fang, J.G.; Gao, Y.K.; Sun, G.Y.; Zhang, Y.T.; Li, Q. Crashworthiness design of foam-filled bitubal structures with uncertainty. Int. J. Non-Linear Mech. 2014, 67, 120–132. [Google Scholar] [CrossRef]
- Xiao, Z.; Fang, J.G.; Sun, G.Y.; Li, Q. Crashworthiness design for functionally graded foam-filled bumper beam. Adv. Eng. Softw. 2015, 85, 81–95. [Google Scholar] [CrossRef]
- He, Q.; Ma, D.W.; Zhang, Z.D.; Yao, L. Mean compressive stress constitutive equation and crashworthiness optimization design of three novel honeycombs under axial compression. Int. J. Mech. Sci. 2015, 99, 274–287. [Google Scholar] [CrossRef]
- Ko, Y.; Ahn, K.; Huh, H.; Choi, W.; Jung, H.; Kwon, T. Evaluation of crash energy absorption capacity of a tearing tube. Exp. Appl. Mech. 2010, 6, 647–654. [Google Scholar] [CrossRef]
- Jahromi, A.G.; Hatami, H. Energy absorption performance on multilayer expanded metal tubes under axial impact. Thin-Walled Struct. 2017, 116, 1–11. [Google Scholar] [CrossRef]
- Hatami, H.; Rad, M.S.; Jahromi, A.G. A theoretical analysis of the energy absorption response of expanded metal tubes under impact loads. Int. J. Impact Eng. 2017, 109, 224–239. [Google Scholar] [CrossRef]
- Nouri, M.D.; Hatami, H.; Jahromi, A.G. Experimental and numerical investigation of expanded metal tube absorber under axial impact loading. Struct. Eng. Mech. 2015, 54, 1245–1266. [Google Scholar] [CrossRef] [Green Version]
- Hatami, H.; Nouri, M.D. Experimental and numerical investigation of lattice-walled cylindrical shell under low axial impact velocities. Lat. Am. J. Solids Struct. 2015, 12, 1950–1971. [Google Scholar] [CrossRef] [Green Version]
- Yang, J.; Luo, M.; Hua, Y.; Lu, G. Energy absorption of expansion tubes using a conical–cylindrical die: Experiments and numerical simulation. Int. J. Mech. Sci. 2010, 52, 716–725. [Google Scholar] [CrossRef]
- Qi, C.; Yang, S.; Dong, F. Crushing analysis and multiobjective crashworthiness optimization of tapered square tubes under oblique impact loading. Thin-Walled Struct. 2012, 59, 103–119. [Google Scholar] [CrossRef]
- Guillow, S.R.; Lu, G.; Grzebieta, R.H. Quasi-static axial compression of thin-walled circular aluminium tubes. Int. J. Mech. Sci. 2001, 43, 2103–2123. [Google Scholar] [CrossRef]
- Reddy, T.Y. Guist and Marble revisited—On the natural knuckle radius in tube inversion. Int. J. Mech. Sci. 1992, 34, 761–768. [Google Scholar] [CrossRef]
- Reid, S.R.; Harrigan, J.J. Transient effects in the quasi-static and dynamic internal inversion and nosing of metal tubes. Int. J. Mech. Sci. 1998, 40, 263–280. [Google Scholar] [CrossRef]
- Shakeri, M.; Salehghaffari, S.; Mirzaeifar, R. Expansion of circular tubes by rigid tubes as impact energy absorbers: Experimental and theoretical investigation. Int. J. Crashworthiness 2007, 12, 493–501. [Google Scholar] [CrossRef]
- Yan, J.; Yao, S.; Xu, P.; Peng, Y.; Shao, H.; Zhao, S. Theoretical prediction and numerical studies of expanding circular tubes as energy absorbers. Int. J. Mech. Sci. 2016, 105, 206–214. [Google Scholar] [CrossRef]
- Al-Abri, O.S.; Pervez, T. Structural behavior of solid expandable tubular undergoes radial expansion process–analytical, numerical, and experimental approaches. Int. J. Solids Struct. 2013, 50, 2980–2994. [Google Scholar] [CrossRef] [Green Version]
- Seibi, A.C.; Barsoum, I.; Molki, A. Experimental and numerical study of expanded aluminum and steel tubes. Procedia Eng. 2011, 10, 3049–3055. [Google Scholar] [CrossRef]
- Yao, S.; Li, Z.; Yan, J.; Xu, P.; Peng, Y. Analysis and parameters optimization of an expanding energy-absorbing structure for a rail vehicle coupler. Thin-Walled Struct. 2018, 125, 129–139. [Google Scholar] [CrossRef]
- Zhang, B.; Zhao, H. Optistruct-based anti-crawler structure optimization design. Railr. Cars 2011, 28, 52–56. [Google Scholar] [CrossRef]
- Gao, G.; Guan, W.; Li, J.; Dong, H.; Zou, X.; Chen, W. Experimental investigation of an active–passive integration energy absorber for railway vehicles. Thin-Walled Struct. 2017, 117, 89–97. [Google Scholar] [CrossRef]
- Ihsan, M.N.; Santosa, S.P.; Gunawan, L.; Budiwantoro, B. Design and optimization of anti-climber device for light rail transit crash energy management system. Int. J. Crashworthiness 2022. [Google Scholar] [CrossRef]
- Guan, W.; Gao, G. Crashworthiness analysis of shrink circular tube energy absorbers with anti-climbers under multiple loading cases. Mech. Adv. Mater. Struct. 2022. [Google Scholar] [CrossRef]
- Wang, W.; Jiang, J.; Wang, Q. The simulation study for energy-absorbing properties of the railway vehicle’s anti-climber with different vertical offsets. Appl. Mech. Mater. 2013, 300–301, 160–165. [Google Scholar] [CrossRef]
- Gao, G.; Shu, K.; Guan, W.; Yu, Y. Crashworthiness analysis of shrink circular tube energy absorbers with an anti-clamber for trains. J. Railw. Sci. Eng. 2022, 19, 520–527. [Google Scholar] [CrossRef]
- Zhou, H.; Mei, M.; Zhang, J.; Tu, H. Investigations on the vertical buckling of railway vehicle’s anti-climber. Int. J. Crashworthiness 2019, 26, 171–181. [Google Scholar] [CrossRef]
- Yang, J.; Tang, Z.; He, F.; Zhang, Y.; Yu, Y. Energy absorption and anti-impact properties of mine diameter-expanding energy absorption components. J. Vib. Shock. 2015, 34, 134–138. [Google Scholar] [CrossRef]
- Paz, J.; Diaz, J.; Romera, L.; Costas, M. Crushing analysis and multi-objective crashworthiness optimization of GFRP honeycomb-filled energy absorption devices. Finite Elem. Anal. Des. 2014, 91, 30–39. [Google Scholar] [CrossRef] [Green Version]
- Oudjene, M.; Ben-Ayed, L.; Delamézière, A.; Batoz, J.L. Shape optimization of clinching tools using the response surface methodology with Moving Least-Square approximation. J. Mater. Process. Tech. 2009, 209, 289–296. [Google Scholar] [CrossRef]
Figure 1.
Energy-absorbing components at the head of a rail vehicle.

Figure 2.
Anti-crawler specimen.

Figure 3.
Dynamic impact (a) illustration and (b) experimental scene.

Figure 4.
Test device (a) sensor and (b) air cannon.

Figure 5.
Time–displacement graph.

Figure 6.
Time–velocity graph.

Figure 7.
Displacement versus force and energy: (a) displacement–force graph; (b) displacement–energy graph.
Figure 7.
Displacement versus force and energy: (a) displacement–force graph; (b) displacement–energy graph.

Figure 8.
Expansion collapse tube deformation diagram and force analysis of the base element: (a) expansion deformation diagram; (b) force diagram for the base element [27].
Figure 8.
Expansion collapse tube deformation diagram and force analysis of the base element: (a) expansion deformation diagram; (b) force diagram for the base element [27].

Figure 9.
Expansion tube base element body (taken in half) force analysis [27].
Figure 9.
Expansion tube base element body (taken in half) force analysis [27].

Figure 10.
FE model for analysis.

Figure 11.
An illustration of a piecewise linear approximation of the stress–strain curve for a given material: (a) a bilinear model; (b) a multilinear model.
Figure 11.
An illustration of a piecewise linear approximation of the stress–strain curve for a given material: (a) a bilinear model; (b) a multilinear model.

Figure 12.
Effective stress–strain for the material of the deformable tube.

Figure 13.
Comparison of the deformation process: (a) during the process; (b) finished.

Figure 14.
High-speed photographic documentation.

Figure 15.
Time–force curves for the simulation and experiment.

Figure 16.
Main effect charts: (a) main effect of variables on Favg; (b) main effect of variables on SEA.
Figure 16.
Main effect charts: (a) main effect of variables on Favg; (b) main effect of variables on SEA.

Figure 17.
The response surface for Favg and SEA: (a) Favg vs. μ and α; (b) Favg vs. T and α; (c) Favg vs. T and μ; (d) SEA vs. μ and α; (e) SEA vs. T and α; (f) SEA vs. T and μ.
Figure 17.
The response surface for Favg and SEA: (a) Favg vs. μ and α; (b) Favg vs. T and α; (c) Favg vs. T and μ; (d) SEA vs. μ and α; (e) SEA vs. T and α; (f) SEA vs. T and μ.

Figure 18.
MOGA algorithm flow chart.

Figure 19.
Initial and optimized time–force graph.


Table 1.
Vehicle mass distribution.
| Component | Parameters | Value |
|---|---|---|
| Deformable tube | Inner radius r (mm) | 65 |
| Section length (mm) | 395 | |
| Thickness T (mm) | 6 | |
| Conical mandrel | Maximum outer radius R (mm) | 69 |
| Slope angle α (°) | 15 |
Table 2.
Values of full factorial design.
| Design Variable | Full Factorial Design | |
|---|---|---|
| Deformable Tube | Levels | Values |
| μ | 5 | 0.04, 0.08, 0.12, 0.16, 0.20 |
| α (°) | 4 | 10, 15, 20, 25 |
| T (mm) | 7 | 5, 5.5, 6, 6.5, 7, 7.5, 8 |
Table 3.
Residuals for Favg from the MLSM method.
| T (mm) | μ | α (°) | Favg_FEM (kN) | Favg_MLSM (kN) | Absolute Percent Error (%) |
|---|---|---|---|---|---|
| 5.5 | 0.08 | 25 | 497.31048 | 503.27124 | −1.19859 |
| 5.5 | 0.12 | 15 | 511.79283 | 506.32325 | 1.068709 |
| 5.5 | 0.20 | 15 | 532.98385 | 540.25486 | −1.36420 |
| 6 | 0.08 | 15 | 537.10716 | 531.59944 | 1.025441 |
| 6 | 0.20 | 15 | 597.39303 | 590.07693 | 1.224670 |
| 6 | 0.12 | 10 | 523.17761 | 517.16446 | 1.149351 |
| 6 | 0.16 | 10 | 543.37462 | 537.62911 | 1.057375 |
| 6.5 | 0.12 | 25 | 657.29042 | 648.74385 | 1.300273 |
| 6.5 | 0.16 | 15 | 626.80114 | 618.91920 | 1.257487 |
| 7 | 0.08 | 10 | 560.73874 | 566.19429 | 0.972922 |
| 7.5 | 0.20 | 20 | 742.31293 | 751.85391 | −1.28530 |
| 8 | 0.12 | 15 | 746.70081 | 737.75697 | 1.197779 |
| 8 | 0.20 | 15 | 787.34132 | 779.52082 | 0.993282 |
Table 4.
Residuals for SEA from the MLSM method.
| T (mm) | μ | α (°) | SEA_FEM (kJ/kg) | SEA_MLSM (kJ/kg) | Absolute Percent Error (%) |
|---|---|---|---|---|---|
| 5 | 0.16 | 15 | 22.38567 | 24.13961 | −7.83512 |
| 5.5 | 0.16 | 25 | 31.56900 | 33.34095 | −5.61293 |
| 5.5 | 0.16 | 10 | 20.63010 | 22.14823 | −7.35877 |
| 6 | 0.20 | 15 | 32.44049 | 30.74795 | 5.217536 |
| 6 | 0.12 | 10 | 24.91362 | 23.64514 | 5.091509 |
| 6 | 0.20 | 10 | 28.75704 | 27.03364 | 5.99296 |
| 7.5 | 0.16 | 25 | 33.30909 | 35.80779 | −7.50158 |
| 7.5 | 0.20 | 15 | 25.71904 | 27.03243 | −5.10669 |
| 7.5 | 0.20 | 10 | 21.74631 | 23.24845 | −6.90756 |
| 8 | 0.12 | 25 | 33.22336 | 35.08246 | −5.59577 |
| 8 | 0.16 | 25 | 42.95868 | 39.07978 | 9.029371 |
| 8 | 0.12 | 20 | 28.57145 | 30.23943 | −5.83794 |
| 8 | 0.12 | 15 | 25.00158 | 26.32633 | −5.29867 |
| 8 | 0.16 | 15 | 32.47899 | 29.82837 | 8.16103 |
| 8 | 0.12 | 10 | 20.53628 | 21.96152 | −6.94012 |
| 8 | 0.16 | 10 | 27.36283 | 25.33468 | 7.412065 |
Table 5.
Values of full factorial design.
| Objective | Favg | SEA |
|---|---|---|
| R2 | 0.999235 | 0.961405 |
| RAAE | 0.004232 | 0.027534 |
Table 6.
Confirmation experiment of the optimal solution.
| Maximum Iterations | Minimum Number of Iterations | Population Size | Mutation Rate | Elite Size/% | Constraint Violation Law Rate/% | Nondominance Number of Points |
|---|---|---|---|---|---|---|
| 50 | 25 | 70 | 0.01 | 10 | 0.1 | 500 |
Table 7.
Confirmation experiment for the optimal solution.
| Favg/(kN) | SEA/(kJ/kg) | |
|---|---|---|
| Predicted | 602.99 | 37.01 |
| Numerical | 595.98 | 36.52 |
| Error | 1.2% | 1.3% |
Table 8.
Comparison of various values between the initial and the optimization results.
| T (mm) | μ | α (°) | Favg/(kN) | SEA/(kJ/kg) | |
|---|---|---|---|---|---|
| Initial values | 6 | 0.1 | 15 | 558.24 | 27.73 |
| Optimum values | 5.76 | 0.178 | 25 | 595.98 | 36.52 |
Disclaimer/Publisher’s Note: The statements, opinions and data contained in all publications are solely those of the individual author(s) and contributor(s) and not of MDPI and/or the editor(s). MDPI and/or the editor(s) disclaim responsibility for any injury to people or property resulting from any ideas, methods, instructions or products referred to in the content. |
© 2023 by the authors. Licensee MDPI, Basel, Switzerland. This article is an open access article distributed under the terms and conditions of the Creative Commons Attribution (CC BY) license (https://creativecommons.org/licenses/by/4.0/).
Share and Cite
MDPI and ACS Style
Zhao, Z.; Xu, P. Analysis and Optimization of an Expansion Energy-Absorbing Anti-Crawler for Rail Vehicles. Sustainability 2023, 15, 6288. https://doi.org/10.3390/su15076288
AMA Style
Zhao Z, Xu P. Analysis and Optimization of an Expansion Energy-Absorbing Anti-Crawler for Rail Vehicles. Sustainability. 2023; 15(7):6288. https://doi.org/10.3390/su15076288
Chicago/Turabian StyleZhao, Zelong, and Ping Xu. 2023. "Analysis and Optimization of an Expansion Energy-Absorbing Anti-Crawler for Rail Vehicles" Sustainability 15, no. 7: 6288. https://doi.org/10.3390/su15076288
Note that from the first issue of 2016, this journal uses article numbers instead of page numbers. See further details here.