Voronoi Diagram
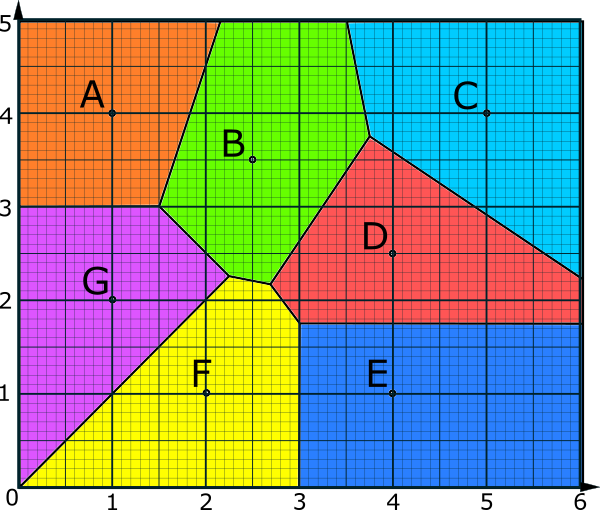
A Voronoi diagram is a geometric partitioning of a space into regions based on the proximity to a specified set of points. In other words, for a given set of points (called seeds, sites, or generators), the Voronoi diagram divides the space into regions, where each region consists of all points closer to a particular seed point than to any other seed point.
In the context of machine learning, Voronoi diagrams can be used in various ways:
1. Clustering: Voronoi diagrams can be used to visualize the clusters formed by clustering algorithms such as k-means. Each cluster centroid corresponds to a seed point, and the Voronoi regions represent the points closest to each centroid.
2. Nearest Neighbor Search: Voronoi diagrams are useful for efficient nearest neighbor search. Given a set of points, the Voronoi region of each point contains all points for which that point is the nearest neighbor. This property can be exploited to speed up nearest neighbor search algorithms.
3. Feature Space Analysis: In feature space analysis, Voronoi diagrams can help visualize decision boundaries in classification tasks. Each seed point can represent a class label, and the Voronoi region associated with each seed point represents the region of feature space where that class is most likely to be assigned.
4. Spatial Analysis: Voronoi diagrams have applications in spatial analysis, such as determining optimal locations for facilities or analyzing geographic patterns.
Overall, Voronoi diagrams are a powerful tool with diverse applications in machine learning and various other fields. They provide a geometric perspective on data distribution and can be used to gain insights into complex datasets.
Congratulations on your new article! Looking forward to diving into it. Keep up the great work!