Numerical Simulation on Shear Behavior of Double Rough Parallel Joints Under Constant Normal Stiffness Boundary Condition
 Jie Liu
 Jiahong Wu
 Xiaoshuang Li
 He Zhang
 Yanbin Song
- 1Key Laboratory of Rock Mechanics and Geohazards of Zhejiang Province, Shaoxing University, Shaoxing, China
- 2School of Civil Engineering, Shaoxing University, Shaoxing, China
The shear characteristics of rock joints under constant normal stiffness (CNS) boundary condition are critical to the stability of underground engineering rock mass. Five different rock joint profiles with random morphology were constructed using the independent segmentation method of the Hurst exponent. Based on the continuously yielding joint model, the discrete element calculation models of double rough parallel joints with different joint surface roughness and spacing of joints under CNS boundary condition were established using UDEC software to investigate the shear effect of joints under CNS boundary condition. The results show that under CNS boundary condition, the shear stress, normal displacement, normal stress, and surface resistance index (SRI) all increase with the increase of joint surface roughness coefficient (JRC) for both single- and double-joint specimens, and these of the single-joint are greater than these of the double-joint. With the increase of the joint spacing d, the peak shear stress τy, and the peak surface resistance index (SRIp) show a gradually increasing trend, and the influence of d on τy and SRIp is greater with the increase of JRC, and both τy and SRIp show a linear increasing trend with the increase of JRC. With the increase of d for the same JRC, both normal displacement and normal stress show a gradually increasing trend, and also, the increased amplitudes gradually increase; with the increase of JRC for the same d, the two parameters also show an increasing trend.
Introduction
A large number of joints that exist in natural rock masses can play a vital role in controlling the shear and deformability properties of engineering rock masses. A critical failure mode in rock masses is the shearing of rock joints, and thus, the shear characteristics of joints have been an important research topic in the field of rock mechanics (Bahaaddini, 2017). For most underground projects, the shear failure of rock joints is constrained by the surrounding rock, and the normal stress increases with increasing shear dilation displacement. Therefore, the constant normal load (CNL) boundary condition is no longer applicable, and the constant normal stiffness (CNS) boundary condition should be used (Indraratna and Thirukumaran, 2015; Thirukumaran and Indraratna, 2016; Shrivastava and Rao, 2018; Liu R. C. et al., 2020). At present, the study of the shear properties of single joints has been very mature. However, joints in natural rock masses cannot often exist alone, and the interaction between multiple joints has an important effect on the mechanical properties of rock masses.
Conducting a direct shear test is a standard experimental methodology to evaluate the shear behavior of rock joints (Saadat and Taheri, 2020). Shear failure of rock joints under CNL boundary conditions has been widely investigated due to its simplicity and ease of experimentation. Patton (1966) conducted direct shear tests on saw-toothed synthetic rock joints and proposed a bilinear envelope to predict the shear resistance of rock joints under different constant normal stresses. Li et al. (2017) proposed a fractal model to predict the shear behavior of a large-scale rock joint during shearing under CNL conditions. Oh et al. (2017) numerically studied the shear dilation of a saw-toothed rock joint under CNL condition. Zhou et al. (2019) studied the shear deformation characteristics of marble dentate joints with different dentate heights under different normal stresses and proposed an empirical formula to evaluate the shear dilation effect. These works suggested that the shear-induced dilation depends strongly on the relative normal stress. Compared with the CNL boundary condition, the CNS boundary condition is more suitable for deep-seated joints. GU et al. (2003) found that the joint surface wear was related to the joint surface roughness and normal boundary conditions. Lee et al. (2014) studied the effects of loading conditions and rock properties on the surface resistance index (SRI) and normal deformation characteristics of the joints. Li et al. (2018) established an analytical model to predict the shear behavior of rough rock joints under the CNS condition. Cui et al. (2019) carried out shear tests under CNL and CNS boundary conditions and investigated the effects of boundary conditions, initial normal stress, and joint roughness on the shearing behavior of the artificial joints. Han et al. (2020) experimentally investigated the effects of initial normal stress, normal stiffness, and shear rate on the shear properties of rough fracture surfaces and proposed empirical equations to assess the shear stress, normal stress, and normal displacement under cyclic shear loading. Yin et al. (2020) investigated the effects of initial normal stress and joint surface roughness coefficient (JRC) on shear stress, normal displacement, normal stress, and shear wear characteristics of fracture surfaces. Thirukumaran and Indraratna (2016) and Han et al. (2021) summarized the recent progress on shear characteristics of rock joints under CNS boundary conditions. The studies discussed earlier on CNS boundary conditions are mainly based on laboratory experiments and elucidate the important influence of CNS boundary conditions on the shear properties of the joint. As an alternative to experimental tests, many research scholars used advanced numerical techniques to characterize the shear failure of rock joints. Wang et al. (2019) investigated the effect of loading direction and normal stress on shear anisotropy and shear dilation deformation of jointed coal rocks by PFC software. Indraratna and Haque (2000) examined the shear behavior of soft saw-toothed rock joints under CNS conditions using UDEC software. Timothy (2018) investigated the effect of shear dilatancy on shear properties of rock joints after yielding under CNL and CNS boundary conditions using UDEC software. The numerical simulation discussed earlier mainly uses the discrete element method (DEM). This method provides an important reference to successfully carry out the numerical simulation of shear characteristics of rock joints under CNS boundary conditions. However, their study is limited to a single joint without taking into account the multi-joint interaction. A few studies (Han, 2019; Liu R. et al., 2020; Huang et al., 2021) have focused on the shear behavior of specimens containing two or more joints by laboratory experiments. However, the impacts of JRC and joint spacing on the shear behavior cannot be considered systematically due to the lack of a wide range of specimen tests.
To date, few studies have been reported on the shear properties of multi-rough rock joints under CNS boundary conditions (Liu et al., 2017). Although laboratory testing is the most common approach for investigating the shear mechanism of rock joints, setting up experiments is expensive and time-consuming (Saadat and Taheri, 2020). Experimental investigations require researchers to generate a wide range of specimens using various materials and conduct laboratory experiments using advanced laboratory equipment. Compared with laboratory tests, numerical simulations can consider more factors and have significant advantages in time, cost, and complexity (Li et al., 2021a; Li et al., 2021b). DEM based on discontinuous media is a direct modeling approach of joint shear damage and has been widely and successfully applied in modeling the shear behavior of rock joints. Numerical codes based on DEM include UDEC, 3DEC, PFC2D, PFC3D, etc. This method uses contact relations between discrete units instead of complex intrinsic relationships, and it can effectively simulate the macroscopic mechanical behavior of block or granular structural materials. In addition, due to the great complexity in natural jointed systems in surface morphology and spatial distributions, tests on models with parallel joints are still an effective approach for understanding the shear behavior of jointed rock masses. In this paper, a distinct element code UDEC was used to study the shear characteristics of double rough parallel joints under CNS boundary conditions. The evolutions of shear stress, normal stress, normal displacement, and SRI of parallel joints with different JRCs and joint spacing during the entire shear process were analyzed.
Construction of Random Morphology Rock Joint
The JRC was proposed by Barton (1973). JRC is used to describe the surface irregularities, and it ranges from 0 (completely smooth and planar) to 20 (rough and uneven). Generally, JRC is obtained by examining the joint surface using Barton's comb and comparing it with the 10 standard rock profiles proposed by Barton and Choubey (1977). This method is obviously empirical and significantly depends on personal experiences. Therefore, many scholars (Tse and Cruden, 1979; Li and Huang, 2015; Wang et al., 2019) have devoted themselves to the quantitative measurement of JRC from different perspectives. Among them, the method proposed by Tse and Cruden (1979) is widely accepted. Based on this method, the independent segmentation method of Hurst exponent was used to simulate random morphology rock joint, and the specific implementation process is as follows (Zhao et al., 2013).
(1) Suppose the initial joint profile be a straight line;
(2) Split the line with a random point P;
(3) On both sides of the point P, bisect the line with 0.5 mm equipartition distance;
(4) In the vertical direction, the offset of each equipartition point on both sides of the split point with respect to the previous equipartition point is P(x).
where W is the amplitude-dependent parameter; R is a normally distributed random variable with a mean of 0 and a variance of 1; x is the distance from the equipartition point to the point P; H is the Hurst exponent.
(5) Perform JRC calculation of random morphology rock joint. Tse and Cruden (1979) showed that for the Barton standard profile, the relationship between JRC and the root mean square of the first derivative of the profiles Z2 satisfies Eq. 2, and the correlation coefficient between the two reached 0.9863.
where L is the total length of the joint profile; (xi + 1 - xi) is the measurement step width; yi and yi+1 are the coordinates of the y-axis of the ith and i + 1-th joint discrete points; n is the number of discrete points of the joint profile.
The joint profile parameters in Table 1 were used. The calculation program was written in MATLAB language to construct joint profiles with five different JRC values. These JRC values were calculated according to Eqs. 2 and 3. Figure 1 shows five random morphology rock joint profiles called J1, J2, J3, J4, and J5. The height of the joint undulation is magnified by a factor of 3 with respect to the joint length. It is found that the JRC of the joints increases with the increase of undulation. The construction of different rock joint profiles provides a basis for studying the shear characteristics of double rough parallel joints.
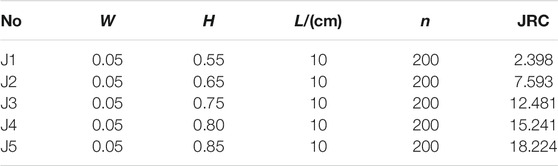
TABLE 1. Rock joint profile parameters with random morphology.
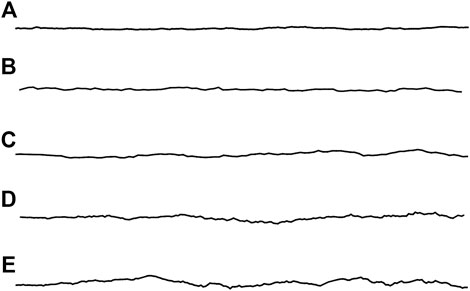
FIGURE 1. Random morphology rock joint profiles with different JRC values. (A) J1 (JRC = 2.398). (B) J2 (JRC = 7.593). (C) J3 (JRC = 12.481). (D) J4 (JRC = 15.241). (E) J5 (JRC = 18.224).
Numerical Model Under Constant Normal Stiffness Boundary Condition
Continuously Yielding Joint Model
The continuously yielding (CY) model developed by Cundall and Lemos (1990) is expected to simulate the nonlinear behavior of rock joints observed during the direct shear testing. Compared with the conventional Mohr–Coulomb slip model, the essential features of the CY model in shear loading can account for joint shear and normal stiffness dependence of normal stress and nonlinear hardening and softening behavior in the post-peak stage.
The incremental normal stress
where
The model assumes that the joints are not tensile, and
where
This model can show irreversible nonlinear behavior from the onset of shearing. The shear stress increment
where
where
where
where
Numerical Model
The practical implications of CNS boundary conditions are movements of unstable blocks in an underground excavation (Figure 2). In Figure 2A, the failure mode of the unstable rock block between two parallel joints is shear-slip failure along the joints. The sliding of such block inevitably increases the normal stress, which in turn increases shear resistance. The size of the unstable block is largely controlled by the joint spacing of a particular set of joints. The CNS boundary condition is usually simulated as an elastic spring with normal stiffness kcns, and the value of kcns is externally controlled by the adjacent rock mass across the joint interface (Thirukumaran and Indraratna, 2016). Apart from this boundary effect, the surfaces of natural rock joints in hard rock are always rough, which has an influence on the shear behavior of joints. Based on Figure 2A, the conceptual model of double rough parallel joints subjected to shear stress under CNS conditions is illustrated in Figure 2B. The joint surface is aligned parallel to the shear direction. The compression of the spring indicates joint dilation and results in an increase in normal stress. The normal stress
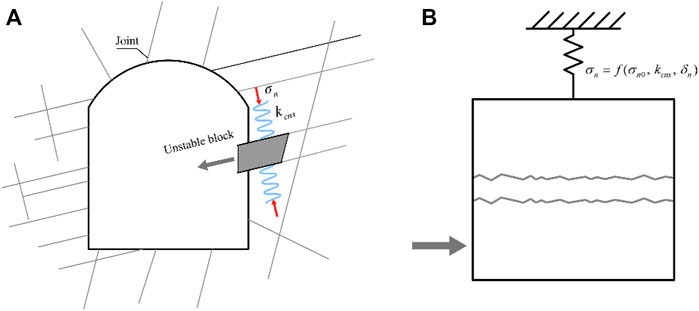
FIGURE 2. Double joint shear-slip failure in an underground excavation. (A) Block failure in wall. (B) Conceptual model of CNS shearing.
To simulate the direct shear test of double rough parallel joints under CNS boundary conditions, the laboratory scale numerical model in UDEC software was established, as shown in Figure 3. The model consists of two blocks where the spring is simulated by the top block to implement the CNS condition, and the rock specimen is simulated by the bottom block. The size of the top spring block is 100 mm in length and 50 mm in height, and the size of the rock block is 100 × 100 mm. To investigate the impact of surface roughness of rock joints on the overall shear behavior, five different rock joint profiles with known JRC values of 2.398 (smooth), 7.593 (rough), 12.481 (rough), 15.241 (very rough), and 18.244 (very rough) in Figure 1 were selected. The rough joints were digitized in AutoCAD software and imported into the numerical model by “crack commands” using the FISH function of UDEC. The two joints with the same JRC values in each numerical model represent one set of joints. They are equally spaced on both sides of the midline in the height direction of the rock block. The CY joint model was used for the joint constitutive model. The normal stiffness corresponding to the spring block is taken as 6 GPa/m, and its stiffness magnitude is mainly determined by the bulk modulus and shear modulus of the spring block. The microparameters of the CY joint model and the macroparameters of the spring block and rock block are shown in Table 2 from the research results of Masivars (2006). The initial normal stress of 3 MPa was applied to the top of the spring block, and the model was allowed to achieve equilibrium. The spring block was fixed in the x-direction on the sides and in both the x-direction and y-direction on the top boundary after the stress was applied. The block located between the spring block and the upper joint was fixed in the x-direction on the vertical sides of the block. The bottom boundary of the lower rock block was fixed in the y-direction. A horizontal velocity of 0.001 m/s was applied on the left wall of the bottom block between the lower joint and the bottom boundary to simulate the shear procedure.
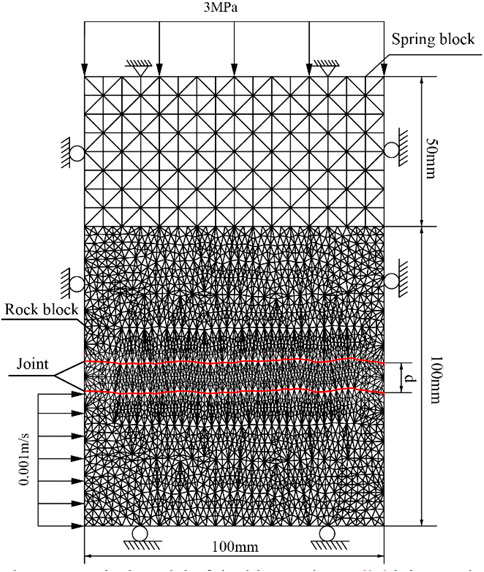
FIGURE 3. Direct shear numerical model of double rough parallel joints under CNS conditions.
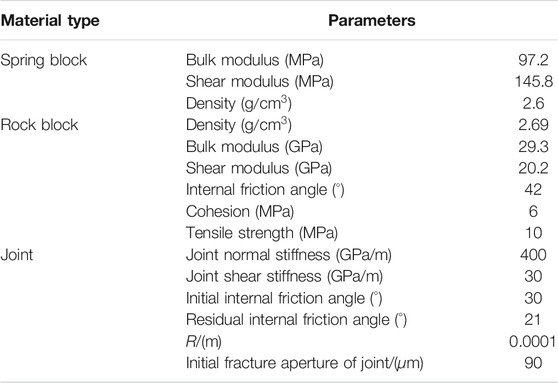
TABLE 2. Calculation parameters of block and joint model.
Model Validation
Under the CNS boundary condition, the increment of normal stress is linearly related to the increment of shear dilation displacement, and the ratio is the normal stiffness. To verify that the normal stiffness remains constant during shear, a specimen with JRC = 12.481 and the joint spacing of 5 mm was used as an example to plot the relationship between shear dilation displacement and normal stress, as shown in Figure 4. It can be observed that the normal stress increases with an increase in the shear dilation displacement. The two are well fitted by a linear function with the slope and intercept approximately equal to the set normal stiffness and initial normal stress, respectively. The coefficient of determination R2 is 0.9998. The results mentioned earlier show that the model can better achieve the CNS boundary condition required for the present study.
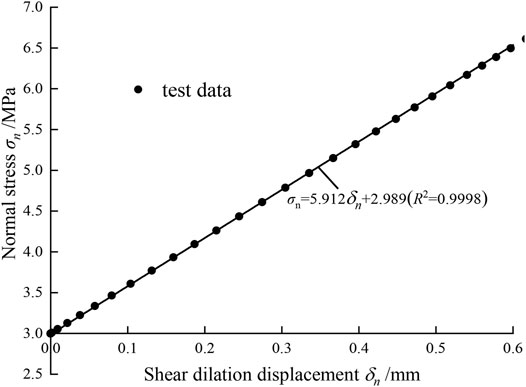
FIGURE 4. Shear dilation displacement and normal stress relation.
Results and Analysis
Comparison of the Shear Properties of Single and Double Joints
To investigate the influence of CNS condition on the overall shear performance of double joints, a series of numerical CNS direct shear tests of single and double joints were carried out on different rock joint profiles J2, J3, and J4. Three different rock joint profiles have known JRC values of 7.593, 12.481, and 18.224, respectively, and the spacing of double joints is 10 mm. Haque (1999) used the spring system to model the CNS direct shear boundary and selected the CY joint model in UDEC; the numerical simulation results are in an excellent agreement with the laboratory data to ensure the capability of the numerical method in reproducing the shear mechanical behavior of the physical specimen.
Figure 5 gives the comparison of shear stress-displacement relations of two kinds of specimens under CNS boundary conditions. It can be seen that the relation curves are divided into four main stages: the elastic stage, the transitional stage, the post-peak stage, and the shear-hardening stage. At the elastic stage, the shear stress increases linearly with the increase of shear displacement. At the transitional stage, the curve is an arc-shaped line and tends to flatten, indicating that the shear stress increases slowly and the initial shear stress peak τy appears. At the post-peak stage, the shear stress decreases gradually with shear displacement. At the shear-hardening stage, the shear stress increases slowly with the increase of shear displacement, and the shear-hardening phenomenon is more obvious in a single-joint specimen than a double-joint. Due to the interaction between the joints, τy is reduced by 11.43% (JRC = 7.593), 15.49% (JRC = 12.481), and 9.69% (JRC = 15.241) for the double-joint specimens compared with the single-joint, respectively. These findings correspond with the laboratory experiment results of Han (2019). In addition, τy increases by 83.64 and 87.24%, respectively, for single- and double-joint specimens as JRC values increase from 7.593 to 18.224.
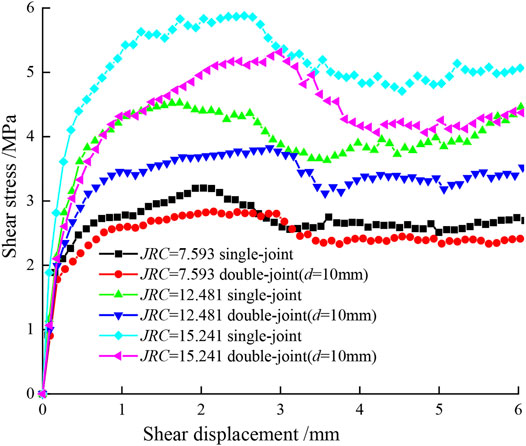
FIGURE 5. Shear displacement-stress relation of single- and double-joint specimens.
Figure 6 shows the comparison of normal-shear displacement relations of the single- and double-joint specimens under CNS boundary conditions. At the initial stage of shear, the shear shrinkage phenomenon occurs in both single- and double-joint specimens. With the increase of shear displacement, the normal displacement gradually increases from negative to positive, and the phenomenon of shear dilation appears. The greater the joint roughness, the more significant the shear dilation, which is because the increase of JRC leads to the greater undulation angle of joints and the more significant climbing effect. The increase rate in normal displacement decreases with the development of shearing due to the progressive increase in deformation of the joint asperities. Figure 7 shows the variation of normal stress with shear displacement for the single- and double-joint specimens. Compared with the single-joint, the normal displacement and normal stress of the double-joint specimens are smaller. When the shear displacement is 6 mm, the normal displacement of the double-joint specimens decreases by 15.67% (JRC = 7.593), 27.98% (JRC = 12.481), and 21.71% (JRC = 15.241), and the normal stress of the double-joint decreases by 5.73% (JRC = 7.593), 17.04% (JRC = 12.481), and 12.81% (JRC = 15.241).
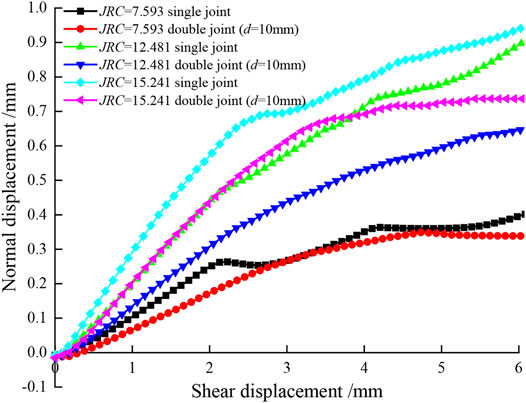
FIGURE 6. Shear-normal displacement relation of single- and double-joint specimens.
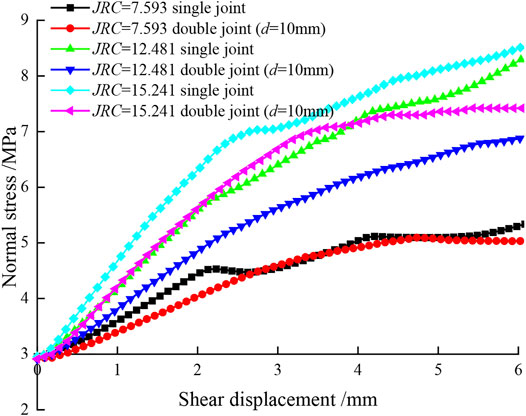
FIGURE 7. Shear displacement and normal stress relation of single- and double-joint specimens.
It is difficult to define a peak point under the CNS condition because test results under certain CNS conditions cannot clearly show maximum shear stress values. Therefore, Lee et al. (2014) defined the ratio of shear stress to normal stress during shearing of rock joints under CNS boundary conditions as the SRI because it always showed a clear peak point under all conditions. Figure 8 represents the variation of SRI with shear displacement for single- and double-joint specimens. The curve is divided into three phases: pre-peak phase, post-peak phase, and residual phase. In the pre-peak phase, SRI gradually increases with the increase of shear displacement, and its growth rate gradually decreases. In the post-peak phase, SRI gradually decreases with the increase of shear displacement. In the residual phase, SRI fluctuates in small increments. For both single- and double-joint specimens, the SRI variation curve gradually shifts upward as the JRC increases and its peak surface resistance index (SRIp) gradually increases. For the same JRC, the SRI of the single-joint is greater than that of the double-joint, and the shear displacement corresponding to the SRIp of the single-joint is smaller than that of the double-joint. The SRIp values of the single-joint were 3.98% (JRC = 7.593), 12.84% (JRC = 12.481), and 13.61% (JRC = 15.241) lower than those of the double-joint, respectively.
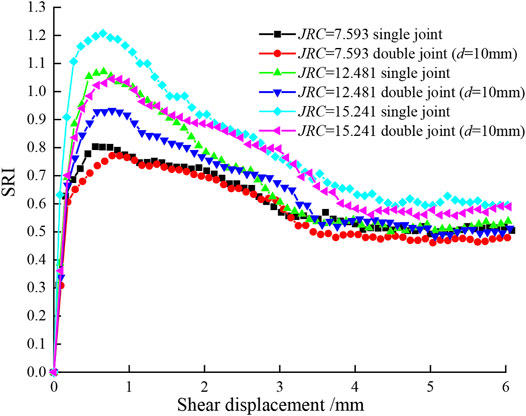
FIGURE 8. Shear displacement and SRI relation of single- and double-joint specimens.
Effect of Joint Spacing on Shear Behavior of Double Joints
To investigate the effect of joint spacing on the shear behavior of double joints, four different spacings of 5, 10, 15, and 20 mm were set for each of the five different joints of J1, J2, J3, J4, and J5, respectively. The variation characteristics of shear stress, normal displacement, normal stress, and SRI of the double-joint were investigated. Figure 9 gives the variation of shear stress with shear displacement for joint J3 with different spacings. τy gradually increases with the increase of the joint spacing. Figure 10 gives the variation of normal displacement with the shear displacement of J3 at different spacings. The normal displacement gradually increases with the increase of joint spacing, and also, the larger shear displacement leads to the more obvious increase of normal displacement. Figure 11 gives the variation of normal stress with shear displacement at different spacings of J3. The normal stress gradually increases with the increase of the joint spacing. Figure 12 gives the variation of SRI with shear displacement for different spacing of J3, and SRIp gradually increases as the joint spacing increases.
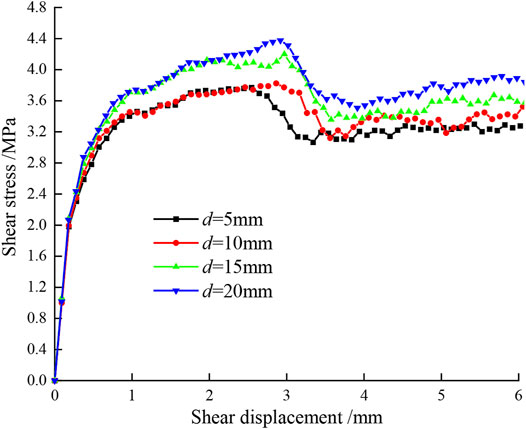
FIGURE 9. Shear displacement-stress relation of J3 with different spacings.
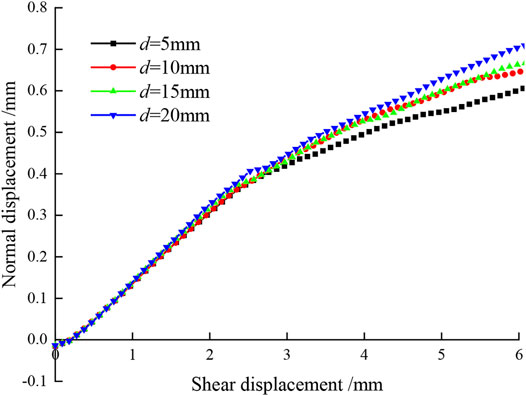
FIGURE 10. Shear-normal displacement relation of J3 with different spacings.
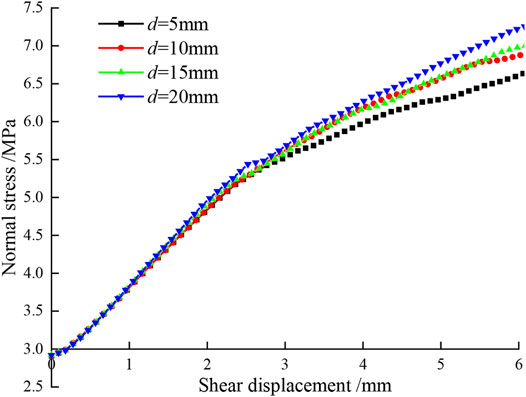
FIGURE 11. Shear displacement and normal stress relation of J3 with different spacings.
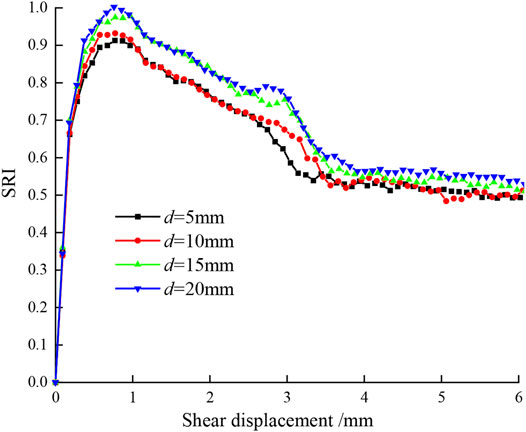
FIGURE 12. Shear displacement relation and SRI of J3 with different spacings.
All data under each scenario were recorded to obtain τy, normal displacement δv6, and normal stress σn6 at the shear displacement of 6 mm and SRIp, as summarized in Table 3.
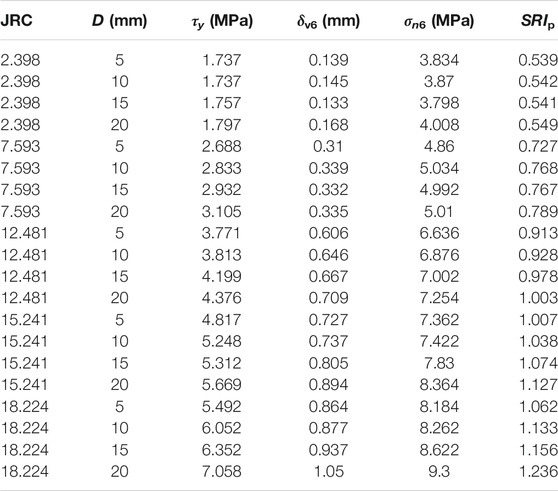
TABLE 3. Summary of τy, δv6, σn6, and SRIp data.
The effect of joint spacing and JRC on τy in the double-joint is shown in Figure 13. From Figure 13A, it can be seen that for the same JRC, τy tends to increase gradually as d increases. As d increases from 5 to 20 mm, τy increases by 3.45% (JRC = 2.398), 15.51% (JRC = 7.593), 16.04% (JRC = 12.481), 17.69% (JRC = 15.241), and 28.51% (JRC = 18.224), respectively. As the JRC increases, the effect of the joint spacing on τy becomes greater. As can be seen from Figure 13B, for the same joint spacing, τy tends to increase linearly as JRC increases, with fitted straight-line slopes of 0.242–0.325 and R2 = 0.9607–0.9821.
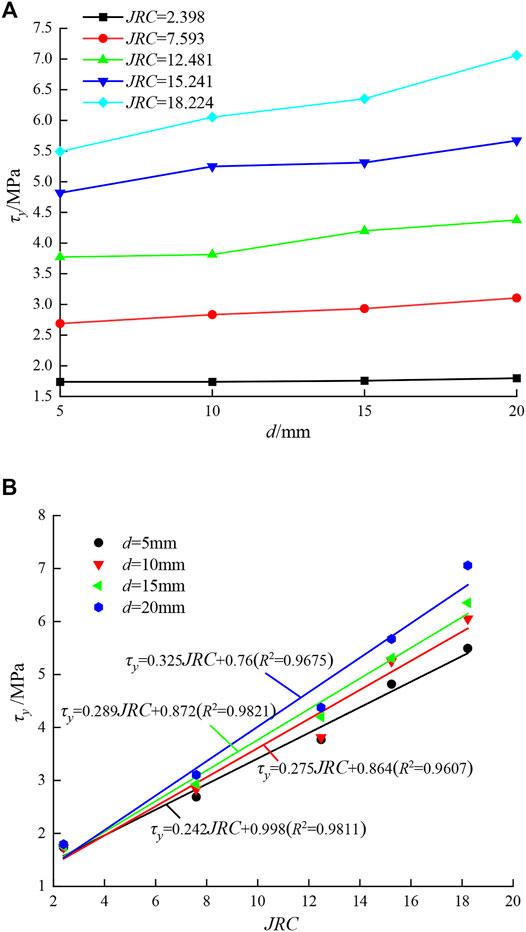
FIGURE 13. Variation of τy with d and JRC. (A) d-τy. (B) JRC-τy.
Figure 14 shows the variation of the normal displacement δv6 with the joint spacing d and JRC at the shear displacement of 6 mm. It can be seen that for the same JRC, δv6 shows a gradual increase with an increase of d. When d increases from 5 to 20 mm, the increases are 20.86% (JRC = 2.398), 8.06% (JRC = 7.593), 16.99% (JRC = 12.481), 22.97% (JRC = 15.241), and 21.53% (JRC = 18.224). For the same d, δv6 tends to increase as JRC increases. δv6 and JRC can be better fitted using a linear function with the slope of 0.0474–0.0586 and R2 = 0.9742–0.9893. The increased amplitude in δv6 increases gradually with the increase of d.

FIGURE 14. Variation of δv6 with d and JRC. (A) d-δv6. (B) JRC-δv6.
Figure 15 shows the variation of the normal displacement σn6 with the joint spacing d and JRC at the shear displacement of 6 mm. It can be seen that for the same JRC, σn6 shows a gradual increase with an increase of d. When d increases from 5 to 20 mm, the increases of σn6 are 5.64% (JRC = 2.398), 3.64% (JRC = 7.593), 9.36% (JRC = 12.481), 13.73% (JRC = 15.241), and 14.53% (JRC = 18.224). For the same d, σn6 tends to increase as JRC increases. σn6 and JRC can be better fitted using a linear function with a slope of 0.284–0.352 and R2 = 0.9734–0.9881. The increased amplitude in σn6 increases gradually with the increase of d.
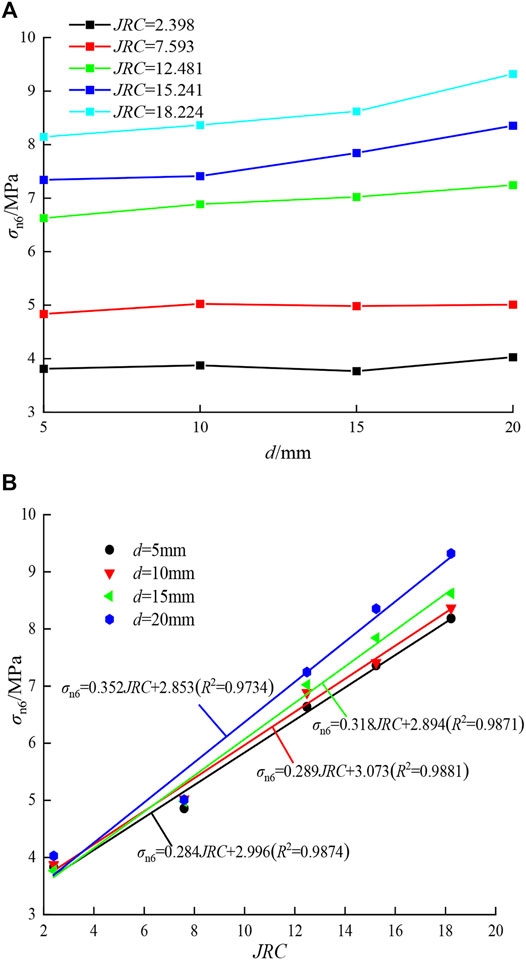
FIGURE 15. Variation of σn6 with d and JRC. (A) d-σn6. (B) JRC-σn6.
Han (2019) experimentally investigated the influence of two different joint spacing and JRC values on the mechanical behavior of double-joint specimens during shearing under CNS boundary conditions and found that both joint spacing and JRC have significant effects on peak SRI, and the effect of JRC is greater than that of joint spacing. On this basis, we performed numerical tests of four different joint spacing and five different JRC vales. Figure 16 shows the variation of SRIp with d and JRC. It can be seen that for the same JRC, SRIp tends to increase gradually as d increases. As d increases from 5 to 20 mm, the increases of SRIp are 1.85% (JRC = 2.398), 8.53% (JRC = 7.593), 9.86% (JRC = 12.481), 11.92% (JRC = 15.241), and 16.38% (JRC = 18.224). As JRC increases, the effect of d on SRIp becomes greater. For the same d, SRIp tends to increase with the increase of JRC. SRIp and JRC can be better fitted using a linear function with a slope of 0.0341–0.0437 and R2 = 0.9884–0.9985. The findings discussed earlier of numerical tests are consistent with the results of Han (2019).
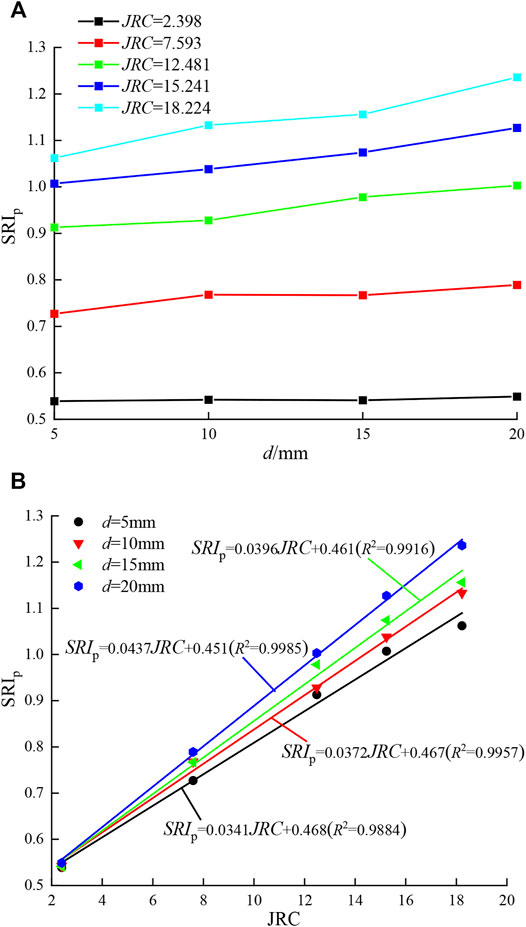
FIGURE 16. Variation of SRIp with d and JRC. (A) d-SRIp. (B) JRC-SRIp.
Conclusion
(1) Under CNS boundary conditions, shear stress, normal displacement, normal stress, and SRI all increase with the increase of JRC for both single- and double-joint specimens, and these of the single-joint are greater than these of the double-joint.
(2) Under the CNS boundary conditions, for the same JRC, the initial peak shear stress τy and the SRIp show a gradual increase with the increase of the joint spacing d. When d increases from 5 to 20 mm, the increases of the two parameters are 3.45–28.51% and 1.85–16.38%, respectively, and as the JRC increases, the effect of d on the two parameters is larger. For the same d, the two parameters tend to increase linearly with an increase of JRC.
(3) Under the CNS boundary conditions, for the same JRC, the normal displacement and normal stress show a gradual increase with the increase of d. When d increased from 5 to 20 mm, the increase of the two parameters are 8.06–22.97% and 3.64–14.53%, respectively, at the shear displacement of 6 mm. For the same d, with the increase of JRC, the two parameters gradually increase, and the increase amplitudes gradually increase with the increase of d.
Data Availability Statement
The original contributions presented in the study are included in the article/supplementary material; further inquiries can be directed to the corresponding author.
Author Contributions
JL designed the research and wrote the original manuscript. JW performed the numerical tests and processed the corresponding data. XL contributed significantly to the analysis and helped to organize the manuscript. HZ and YS revised and edited the final manuscript.
Funding
This study was supported by the National Natural Science Foundation of China (nos. 41867033, 41702327, and 52179112) and the Zhejiang Collaborative Innovation Center for Prevention and Control of Mountain Geological Hazards (no. PCMGH-2017-Y-04).
Conflict of Interest
The authors declare that the research was conducted in the absence of any commercial or financial relationships that could be construed as a potential conflict of interest.
Publisher’s Note
All claims expressed in this article are solely those of the authors and do not necessarily represent those of their affiliated organizations, or those of the publisher, the editors and the reviewers. Any product that may be evaluated in this article, or claim that may be made by its manufacturer, is not guaranteed or endorsed by the publisher.
References
Bahaaddini, M. (2017). Effect of Boundary Condition on the Shear Behaviour of Rock Joints in the Direct Shear Test. Rock Mech. Rock Eng. 50 (5), 1141–1155. doi:10.1007/s00603-016-1157-z
Barton, N., and Choubey, V. (1977). The Shear Strength of Rock Joints in Theory and Practice. Rock Mech. 10 (1-2), 1–54. doi:10.1007/bf01261801
Barton, N. (1973). Review of a New Shear Strength Criterion for Rock Joints. Eng. Geol. 7 (4), 579–602. doi:10.1016/0013-7952(73)90013-6
Cui, G. J., Zhang, C. Q., Han, H. C., Zeng, Z., Zhou, H., Lu, J. J., et al. (2019). Experiment Study on Shear Behavior of Artificial Joint under CNL and CNS Boundary Conditions. Chin. J. Rock Mech. Eng. 38 (S2), 3384–3392.
Cundall, P. A., and Lemos, J. V. (1990). “Numerical Simulation of Fault Instability with the Continuously Yielding Joint Model,” in Rockbursts and Seismicity in Mines. Editor C. Fairhurst (Rotterdam: Balkema), 147–152.
Gu, X. F., Seidel, J. P., and Haberfield, C. M. (2003). Direct Shear Test of Sandstone-Concrete Joints. Int. J. Geomech. 3 (1), 21–33. doi:10.1061/(asce)1532-3641(2003)3:1(21)
Han, G., Jing, H., Jiang, Y., Liu, R., and Wu, J. (2020). Effect of Cyclic Loading on the Shear Behaviours of Both Unfilled and Infilled Rough Rock Joints under Constant Normal Stiffness Conditions. Rock Mech. Rock Eng. 53 (1), 31–57. doi:10.1007/s00603-019-01866-w
Han, G. S. (2019). “Study on Shear Mechanical Behaviours of Multi-Joint Structures of Rock under Constant Normal Stiffness Conditions,”. Ph. D. thesis (Xuzhou, China: China University of Mining and Technology).
Han, G. S., Xiong, F., Zhou, Y., Song, L. B., and Wang, X. K. (2021). Research Progress on Shear Characteristics of Rock Joints under Constant Normal Stiffness Boundary Conditions. Shock Vib 2021, 9670151. doi:10.1155/2021/9670151
Haque, A. (1999). “Shear Behaviour of Soft Rock Joints under Constant Normal Stiffness.” . Ph. D. thesis, (Wollongong, Australia: University of Wollongong).
Huang, N., Han, G., Liu, R., and Jiang, Y. (2021). Mechanical Behaviour of Rock Samples Containing Multiple Parallel Joints during Shearing. Géotechnique Lett. 11, 133–139. doi:10.1680/jgele.19.00081
Indraratna, B., and Haque, A. (2000). “Experimental and Numerical Modeling of Shear Behaviour of Rock Joints.” in GeoEng 2000, An International Conference on Geotechnical and Geological Engineering. Pennsylvania: Technomic Publishing Co Inc, 1.
Indraratna, B., Thirukumaran, S., Brown, E. T., and Zhu, S.-P. (2015). Modelling the Shear Behaviour of Rock Joints with Asperity Damage under Constant Normal Stiffness. Rock Mech. Rock Eng. 48 (1), 179–195. doi:10.1007/s00603-014-0556-2
Lee, Y.-K., Park, J.-W., and Song, J.-J. (2014). Model for the Shear Behavior of Rock Joints under CNL and CNS Conditions. Int. J. Rock Mech. Mining Sci. 70, 252–263. doi:10.1016/j.ijrmms.2014.05.005
Li, X. S., Wang, Y. M., Yang, S., Xiong, J., and Zhao, K. (2021b). Research Progress in the Mining Technology of the Slowly Inclined, Thin to Medium Thick Phosphate Rock Transition from Open-Pit to Underground Mine. Appl. Math. Nonlinear Sci. 6 (1), 319–334. doi:10.2478/amns.2021.2.00017
Li, X. S., Yang, S., Wang, Y. M., Nie, W., and Liu, Z. F. (2021a). Macro-Micro Response Characteristics of Surrounding Rock and Overlying Strata towards the Transition from Open-Pit to Underground Mining. Geofluids 18, 5582218. doi:10.1155/2021/5582218
Li, Y., and Huang, R. (2015). Relationship between Joint Roughness Coefficient and Fractal Dimension of Rock Fracture Surfaces. Int. J. Rock Mech. Mining Sci. 75, 15–22. doi:10.1016/j.ijrmms.2015.01.007
Li, Y., Oh, J., Mitra, R., and Canbulat, I. (2017). A Fractal Model for the Shear Behaviour of Large-Scale Opened Rock Joints. Rock Mech. Rock Eng. 50 (1), 67–79. doi:10.1007/s00603-016-1088-8
Li, Y., Wu, W., and Li, B. (2018). An Analytical Model for Two-Order Asperity Degradation of Rock Joints under Constant Normal Stiffness Conditions. Rock Mech. Rock Eng. 51 (1), 1–15. doi:10.1007/s00603-018-1405-5
Liu, R. C., Lou, S., Li, X. J., Han, G. S., and Jiang, Y. J. (2020a). Anisotropic Surface Roughness and Shear Behaviors of Rough-Walled Plaster Joints under Constant Normal Load and Constant Normal Stiffness Conditions. J. Rock Mech. Geotech. Eng. 12 (02), 130–144. doi:10.1016/j.jrmge.2019.07.007
Liu, R., Han, G., Jiang, Y., Yu, L., and He, M. (2020b). Shear Behaviour of Multi-Joint Specimens: Role of Surface Roughness and Spacing of Joints. Géotechnique Lett. 10 (2), 113–118. doi:10.1680/jgele.19.00044
Liu, X. G., Zhu, W. C., Yu, Q. L., Chen, S. J., and Li, R. F. (2017). Estimation of the Joint Roughness Coefficient of Rock Joints by Consideration of Two-Order Asperity and its Application in Double-Joint Shear Tests. Eng. Geology. 220, 243–255. doi:10.1016/j.enggeo.2017.02.012
Mas Ivars, D. (2006). Water Inflow into Excavations in Fractured Rock-A Three-Dimensional Hydro-Mechanical Numerical Study. Int. J. Rock Mech. Mining Sci. 43 (5), 705–725. doi:10.1016/j.ijrmms.2005.11.009
Oh, J., Li, Y., Mitra, R., and Canbulat, I. (2017). A Numerical Study on Dilation of a Saw-Toothed Rock Joint under Direct Shear. Rock Mech. Rock Eng. 50 (4), 913–925. doi:10.1007/s00603-016-1142-6
Patton, F. (1966). “Multiple Modes of Shear Failure in Rock,” in Proceedings of the 1st ISRM Congress, Lisbon, Portugal, 509–513.
Saadat, M., and Taheri, A. (2020). A Numerical Study to Investigate the Influence of Surface Roughness and Boundary Condition on the Shear Behaviour of Rock Joints. Bull. Eng. Geol. Environ. 79 (5), 2483–2498. doi:10.1007/s10064-019-01710-z
Shrivastava, A. K., and Rao, K. S. (2018). Physical Modeling of Shear Behavior of Infilled Rock Joints under CNL and CNS Boundary Conditions. Rock Mech. Rock Eng. 51, 101–118. doi:10.1007/s00603-017-1318-8
Thirukumaran, S., and Indraratna, B. (2016). A Review of Shear Strength Models for Rock Joints Subjected to Constant Normal Stiffness. J. Rock Mech. Geotechnical Eng. 8 (3), 405–414. doi:10.1016/j.jrmge.2015.10.006
Timothy, R. P. (2018). Laboratory Investigation of Shear Behaviour in Rock Joints under Varying Boundary Conditions. Kingston, Ontario, Canada: Queen’s University.
Tse, R., and Cruden, D. M. (1979). Estimating Joint Roughness Coefficients. Int. J. Rock Mech. Mining Sci. Geomechanics Abstr. 16 (5), 303–307. doi:10.1016/0148-9062(79)90241-9
Wang, C., Wang, L., and Karakus, M. (2019a). A New Spectral Analysis Method for Determining the Joint Roughness Coefficient of Rock Joints. Int. J. Rock Mech. Mining Sci. 113, 72–82. doi:10.1016/j.ijrmms.2018.11.009
Wang, X., Kang, H., and Gao, F. (2019b). Numerical Investigation on the Shear Behavior of Jointed Coal Mass. Comput. Geotechnics 106, 274–285. doi:10.1016/j.compgeo.2018.11.005
Yin, Q., Jing, H. W., Meng, B., Liu, R. C., and Wu, Y. J. (2020). Shear Mechanical Properties of 3D Rough Rock Fracture Surfaces under Constant Normal Stiffness Conditions. Chin. J. Rock Mech. Eng. 372 (11), 58–70.
Zhao, Y. L., Wan, W., Wang, W. J., Wang, M., and Peng, Q. Y. (2013). Shear-Seepage Numerical Simulation and Shear Dilatancy Seepage Model of Rock Joint with Random Morphology. J. China Coal Soc. 38 (12), 2133–2139.
Keywords: UDEC, double rough parallel joints, constant normal stiffness, roughness, joint spacing
Citation: Liu J, Wu J, Li X, Zhang H and Song Y (2022) Numerical Simulation on Shear Behavior of Double Rough Parallel Joints Under Constant Normal Stiffness Boundary Condition. Front. Earth Sci. 9:819290. doi: 10.3389/feart.2021.819290
Received: 21 November 2021; Accepted: 22 December 2021;
Published: 07 February 2022.
Edited by:
Xiaodong Fu, Institute of Rock and Soil Mechanics (CAS), ChinaReviewed by:
Junxin Guo, Southern University of Science and Technology, ChinaChunyang Zhang, Wuhan University of Technology, China
Copyright © 2022 Liu, Wu, Li, Zhang and Song. This is an open-access article distributed under the terms of the Creative Commons Attribution License (CC BY). The use, distribution or reproduction in other forums is permitted, provided the original author(s) and the copyright owner(s) are credited and that the original publication in this journal is cited, in accordance with accepted academic practice. No use, distribution or reproduction is permitted which does not comply with these terms.
*Correspondence: Xiaoshuang Li, xsli2021sx@usx.edu.cn